Why SPY and QQQ are Unaffected by Sharp Deterioration in Breadth
Key Takeaways
- Interest rate and energy shocks put pressure on non-tech groups.
- S&P 500 breadth takes a hard hit and hits a moment of truth.
- Large-cap tech stocks and outsized gains drive SPY and QQQ.
The stock market has become a tale of two markets. QQQ is performing well in September and SPY is flat, but several key groups were hit with strong selling pressure because of the violent moves in oil prices and interest rates. Despite a serious deterioration in breadth, SPY and QQQ remain immune, as they are driven by a handful of large-cap tech-related stocks.
Rate and Energy Shocks Weigh on Non-Tech
September is proving difficult for several key groups, including housing and retail. The PerfChart below shows month-to-date performance for QQQ, SPY, three sector SPDRs, and five industry group ETFs. QQQ is up 3.4%, SPY is flat and the rest are down. This is clearly a market of haves and have-nots.
- Nasdaq 100 ETF (+3.4%)
- S&P 500 SPDR (+.02%)
- Russell 2000 ETF (-4.17%)
- Consumer Discretionary SPDR (-5.38%)
- Utilities SPDR (-6.80%)
- Real Estate SPDR (-5.58%)
- FinTech ETF (-5.80%)
- Home Construction ETF (-6.17%)
- Retail SPDR (-4.65%)
- Solar Energy ETF (-8.62%)
- Gold Miners ETF (-6.25%)
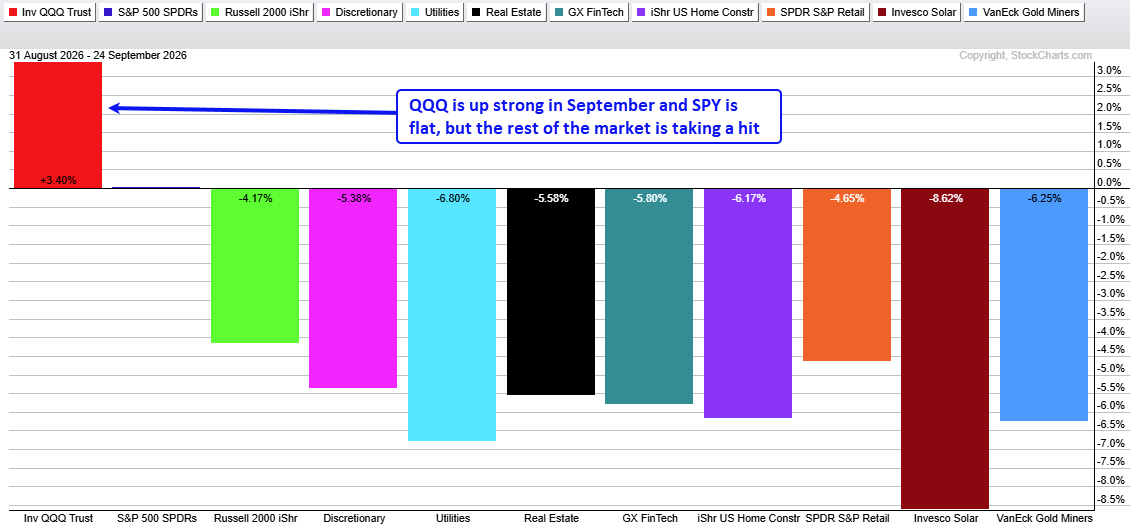
Selling pressure hit these groups as the 12-Month Oil Fund (USL) surged 9% this month and the 10-yr Treasury Yield ($UST10Y) moved from 4.75% to 5.20%. Large-caps and large-cap techs are more insulated from high interest rates and energy prices.
S&P 500 Breadth Takes Hard Hit and Hits Moment of Truth
The next chart shows SPY in the top window and SPX %Above 200-day SMA ($SPXA200R). Chartists can use these two for broad market timing.
SPY remains above its rising 200-day SMA and less than 2% from a 52-week high. Thus, SPY is in a long-term uptrend. Even though SPY held up in September, however, breadth took a hit as the percentage of S&P 500 stocks above their 200-day SMAs moved from 75% to 47% (-28) over the last five weeks. This is an exceptionally sharp deterioration in breadth. See the pink shadings for prior hits.
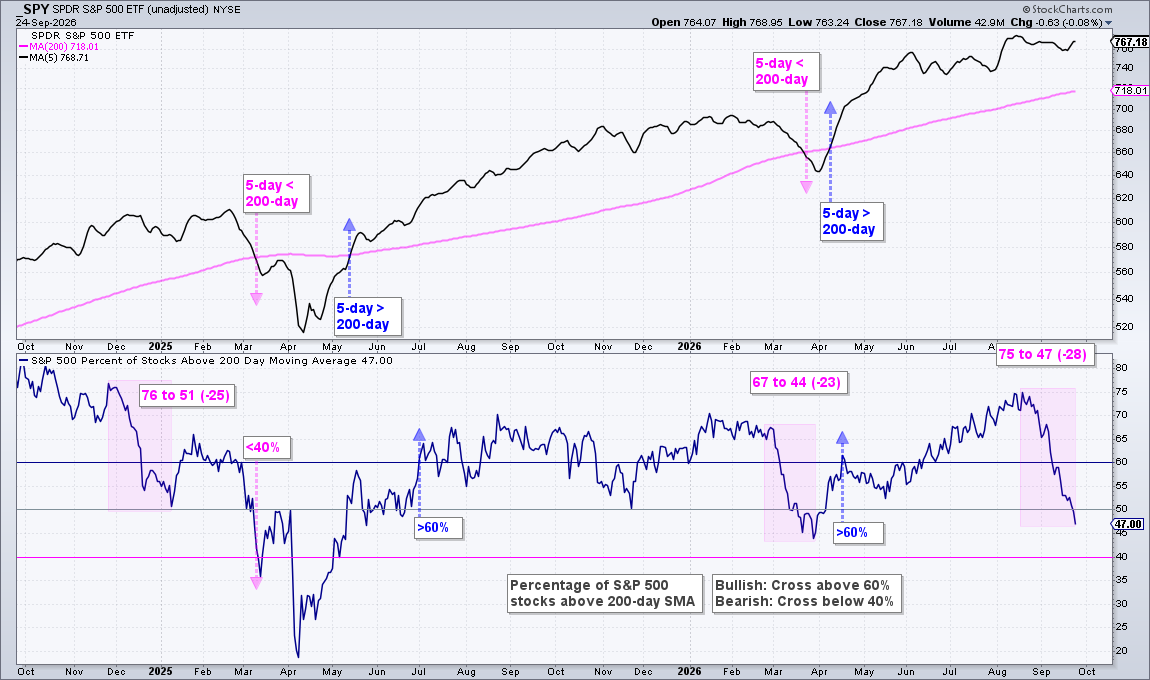
Despite a plunge to 47%, the indicator is not yet bearish. In fact, it is at a moment of truth. A move below 40% would turn this indicator bearish, which occurred on March 12th, 2025 (pink arrow). Should the indicator hold above 40% and stabilize, watch for a move above 60% to revive the bulls. Note how the indicator held above 40% in March and turned up again in April.
TrendInvestorPro maintains a Market Regime page to assess the state of the stock market (bull or bear market). This page includes breadth models, long-term trend signals, yield spreads and Treasury yields. Despite the recent rate shock, the weight of the evidence remains bullish. Note that the Market Regime turned net bullish in July 2025. Click here to take a trial and gain full access.
Outsized Gains in Large-Cap Tech Stocks Drive SPY and QQQ
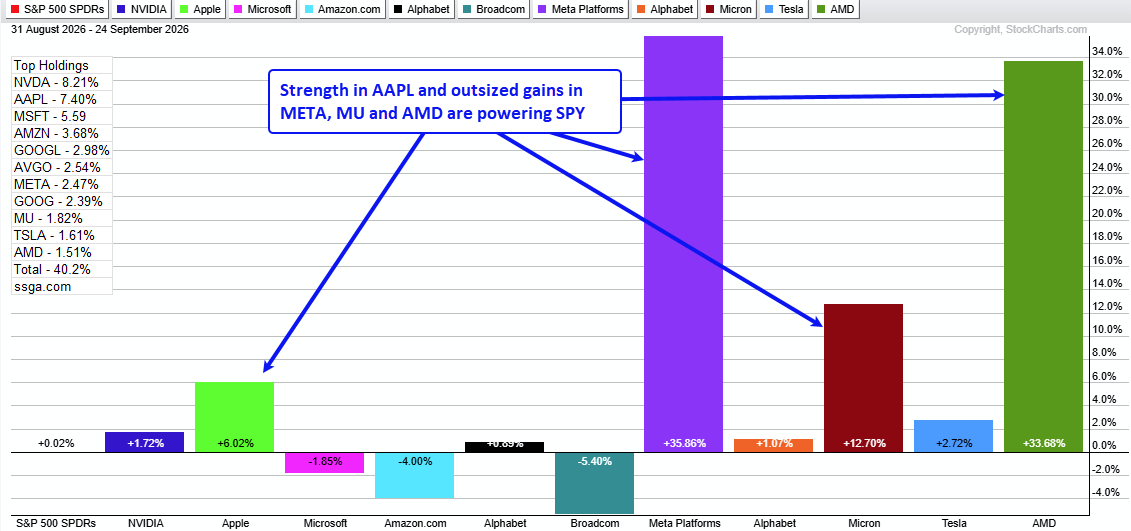
Breadth is an important metric for the broader market, but less so for SPY and QQQ because they are driven by large-caps and large-cap tech stocks. The top 11 stocks account for 40% of SPY, which means the other 489 account for 60%. The top 11 stocks in QQQ account for 52%, which means the other 89 account for 48%.
The PerfChart below shows month-to-date performance for SPY and the top 11 holdings. Eight are up and three are down (MSFT, AMZN, AVGO). Three are up more than 10% and two are up more than 30% (META, AMD). These outsized gains are making up for weakness elsewhere. Also notice that these 11 stocks are part of the tech sector or the MAG7 group. It's all up to tech and the MAG7.
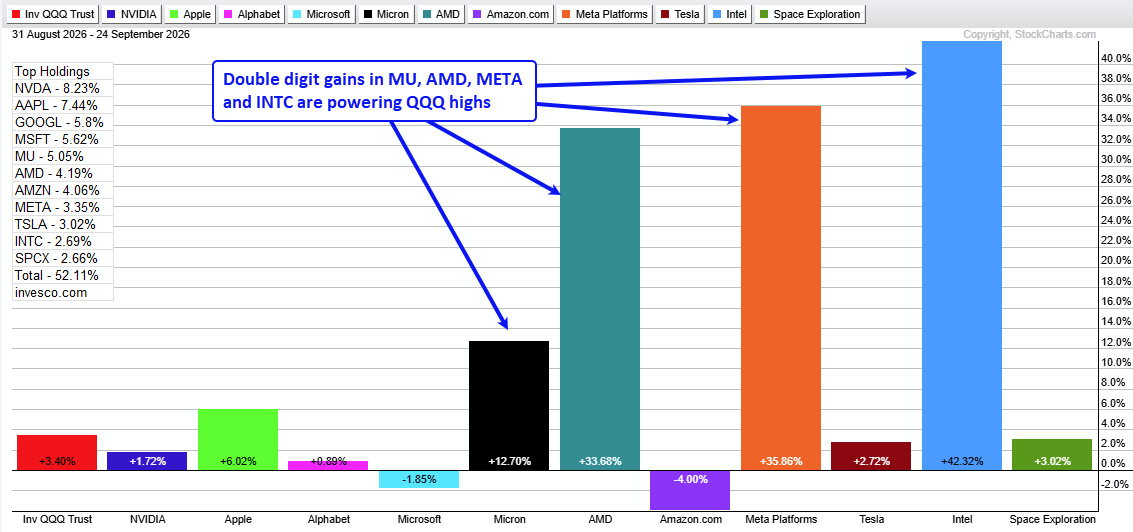
The PerfChart below shows month-to-date performance for QQQ and the top 11 holdings. Nine are up and two are down (MSFT, AMZN). Four are up double digits and three four are up more than 30% (AMD, META, INTC). Again, outsized gains in these three are powering QQQ this month. Big gains in top holdings more than offset weakness elsewhere.
Three Considerations
Here are three considerations when trading SPY and QQQ.
- Ignore broad breadth because the other 489/89 stocks are not the key drivers
- Focus on the largest stocks within these ETFs for clues on underlying strength.
- Analyze the price charts for trends and trading signals.
TrendInvestorPro covers SPY, QQQ, XLK and the leading tech-AI ETFs every week. We take our signals from price action and focus on the leading groups. Click here to learn more about our reports, videos and strategies.