Three Breadth Signals That Help Confirm Market Trends

The major benchmarks are showing renewed signs of resilience, but the underlying message may be more nuanced than the headlines suggest. A first-time viewer of my daily market recap show recently asked:
"You seem to use many breadth measures, including Advance-Decline lines, new highs and new lows, percent above the 50-day, and the Bullish Percent Index. Which one or two have you found to be the most effective and predictive?"
This is such a great question, as it represents a viewer taking action to improve their investment process by improving their routines. And it also indicates that my persistent message of “Don’t ignore market breadth!” appears to have been received loud and clear!
When it comes to market internals, I maintain a very specific, hand-selected list of indicators I review every trading day. And while I track five core metrics, including the Bullish Percent Indexes and new 52-week high/low counts, there are three particular breadth tools that form the absolute foundation of my investment process.
Cumulative Advance-Decline Lines: The Structural Baseline
Going back to my formative years as a technical analyst, I was incredibly fortunate to attend New York meetings of the Market Technicians Association and learn from the legendary Phil Roth, CMT. Phil was a past president of the organization right around the time I earned my CMT credentials, and hearing him present was the first time I truly realized that just looking at the chart of the S&P 500 ($SPX) doesn't give you the whole picture.
Breadth reveals the underlying interplay of all the individual stocks that make up the benchmark. And while I always check the daily Advance-Decline data at the end of the trading day, it’s way more valuable as a position trader to reflect on the trend in the cumulative advance-decline lines.
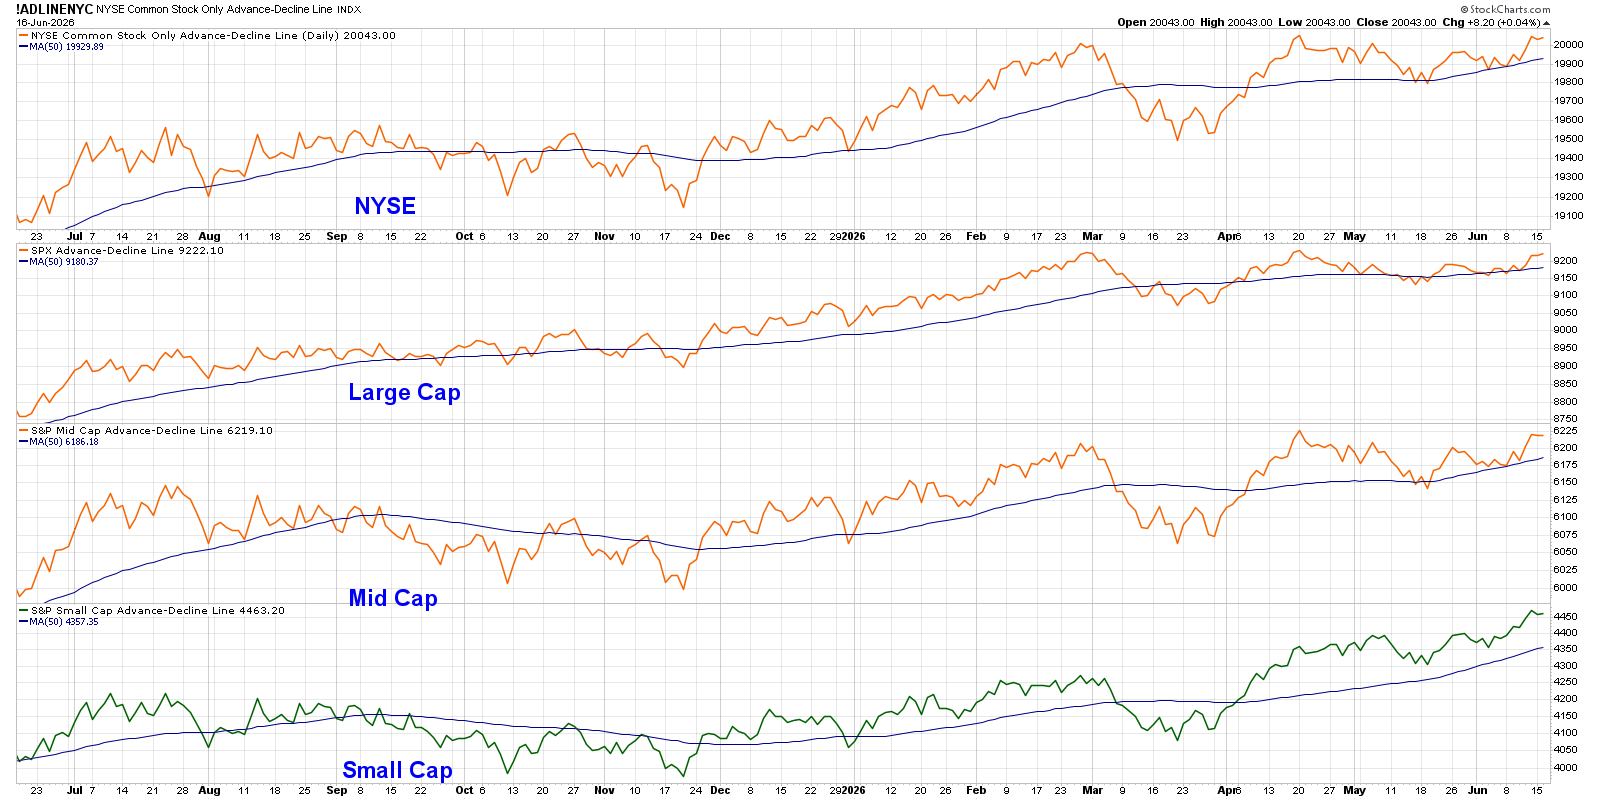
By plotting a running total of daily net advancers, you filter out the day-to-day noise and reveal the true structural trend of market participation. When the broad indexes are grinding higher but the cumulative A-D line begins to flatten or slope downward, it tells you that a dangerously small number of mega-cap names are carrying the heavy lifting.
Reviewing the chart, you can see the small-cap A-D line has already made a new all-time high, but the others have not yet done so. If the S&P 500 makes a new all-time high this summer, but that new high is not confirmed by a similar breakout in the A-D lines, then the breakout should be considered less valid.
The McClellan Oscillator: Catching Shorter-Term Shifts
If the Cumulative A-D line is my long-term structural compass, the McClellan Oscillator is my go-to radar for intermediate and short-term tactical shifts.
Derived from the slope of the NYSE Advance-Decline line, the McClellan Oscillator applies exponential moving averages to smooth out the raw data, creating a magnificent visualization of momentum shifts within market breadth. It's an exceptional tool for identifying when a brief market pullback has reached an oversold extreme or, conversely, when an aggressive surge is starting to run out of underlying gas. When I look for short-term tactical turning points, this is the very first internal indicator I consult.
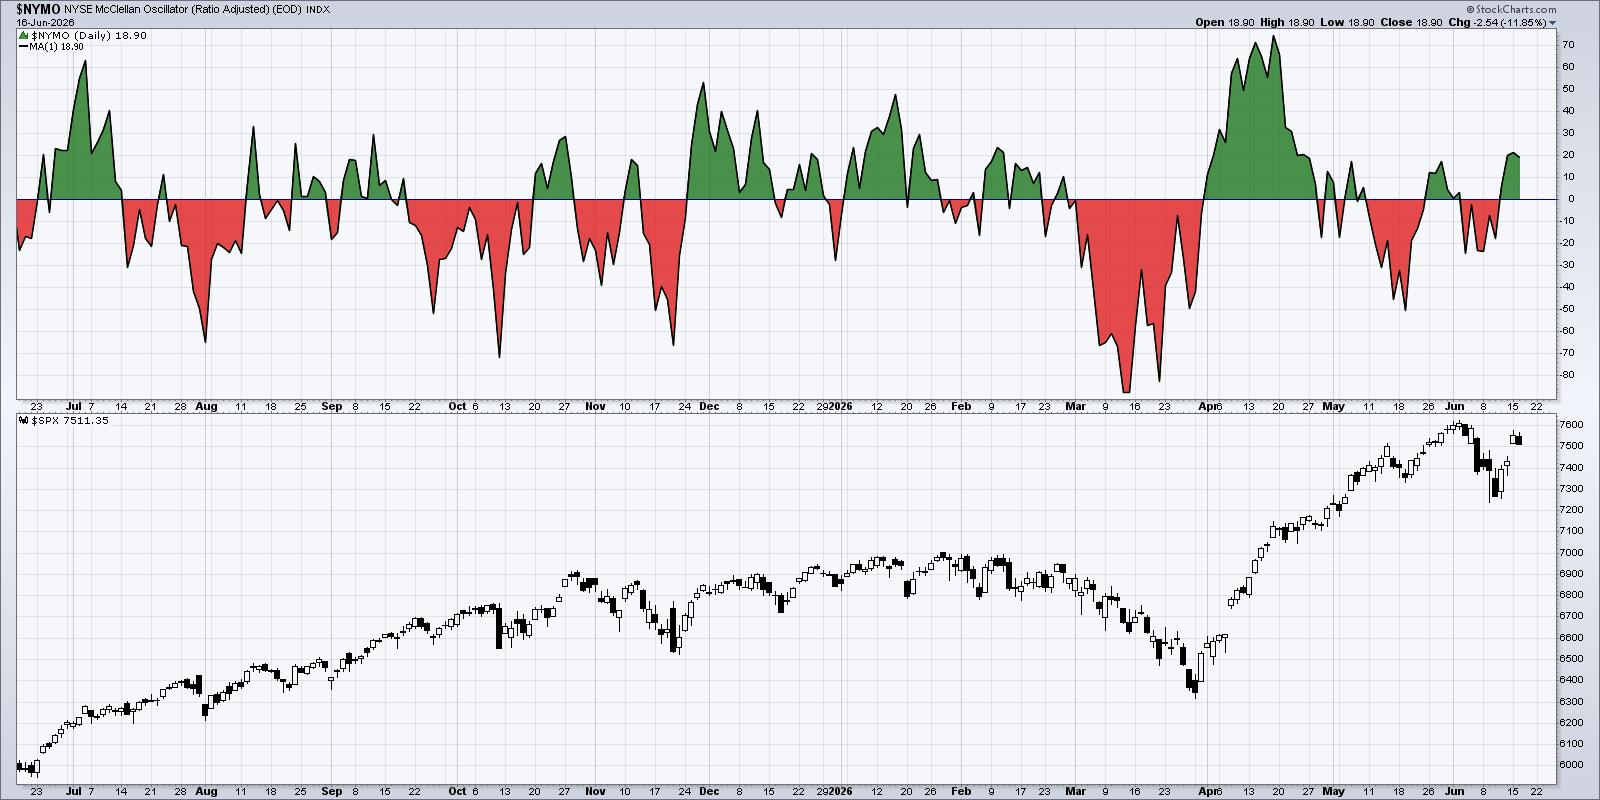
We can see how the contours of the McClellan Oscillator track the recent tactical upswings and downturns for the S&P 500 index. The indicator turned negative in earlier June, marking a risk-off move into the low around 7250. The subsequent recovery saw the oscillator rotate back to a bullish reading, marking breadth improvement as the benchmark rallied into this week.
While a negative reading on the McClellan Oscillator doesn't necessarily suggest a long-term warning sign, I find that, by combining this short-term indicator with other long-term breadth readings, I can evaluate a more complete picture of market participation.
Stocks Above Key Moving Averages (50-Day and 200-Day)
The third component of my core market breadth layout is the percentage of stocks trading above their 50-day and 200-day moving averages. This specific pair of indicators has served me incredibly well over the years because it allows me to relate larger market trends with leadership themes.
A healthy bull market requires broad participation. If a broad index is pressing to new highs, that movement should be validated by individual stocks clearing their own structural hurdles. So, if the market is in a confirmed uptrend, I would need to see more stocks trading above key moving averages.
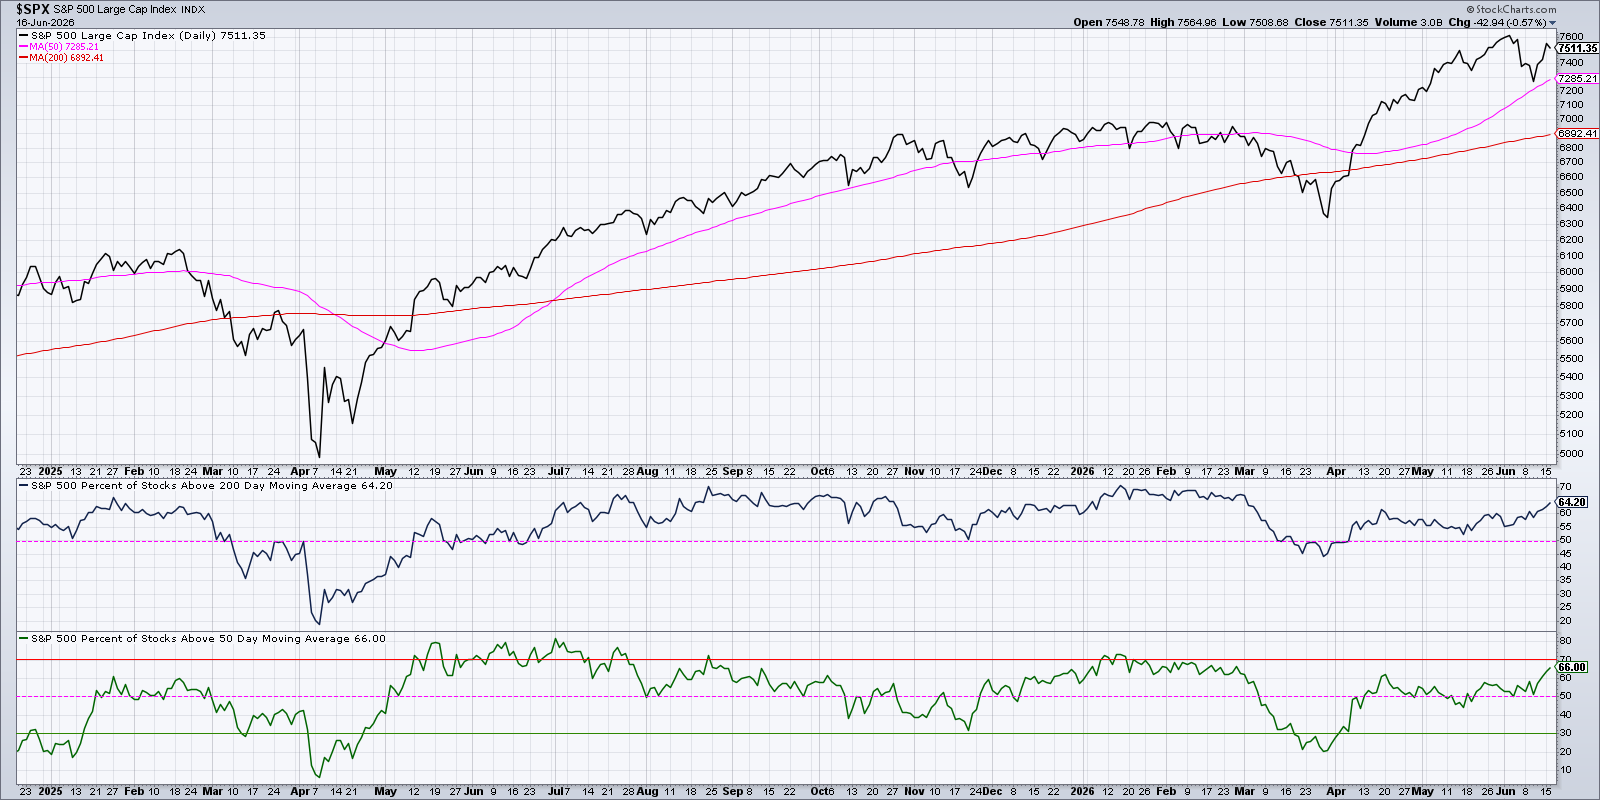
While the Technology sector has experienced elevated volatility in recent weeks, the uptrend in these moving average breadth indicators speaks to the fact that other sectors are clearly improving in June 2026. Neither indicator has been below the 50% threshold since mid-May, suggesting that technology is not the only game in town!
As we enter the “summer doldrums” months, where a summer selloff has often occurred during midterm election years, this chart could provide important insights as to whether the market will follow this normal seasonal pattern. And if these indicators remain above 50%, that would mean that other sectors outside of tech are remaining in a position of strength.
The Takeaway: Build Your Structure Carefully
You cannot fully understand the equity market landscape by looking at price action alone. By combining the structural baseline of Cumulative A-D lines, the tactical momentum of the McClellan Oscillator, and the trend validation of moving average percentages, you too can build a strategic decision engine.
One final note… this article was based on a viewer question from my Friday mailbag episode of my daily market recap show, CHART THIS with Dave Keller. Check out the other questions over on my YouTube channel!

RR#6,
Dave
P.S. Ready to upgrade your investment process? Check out my free behavioral investing course!
David Keller, CMT
President and Chief Strategist
Sierra Alpha Research LLC
marketmisbehavior.com
https://www.youtube.com/c/MarketMisbehavior
Disclaimer: This blog is for educational purposes only and should not be construed as financial advice. The ideas and strategies should never be used without first assessing your own personal and financial situation, or without consulting a financial professional.
The author does not have a position in mentioned securities at the time of publication. Any opinions expressed herein are solely those of the author and do not in any way represent the views or opinions of any other person or entity.