Warning Signs for Stocks: The Hindenburg Omen and Titanic Syndrome Explained
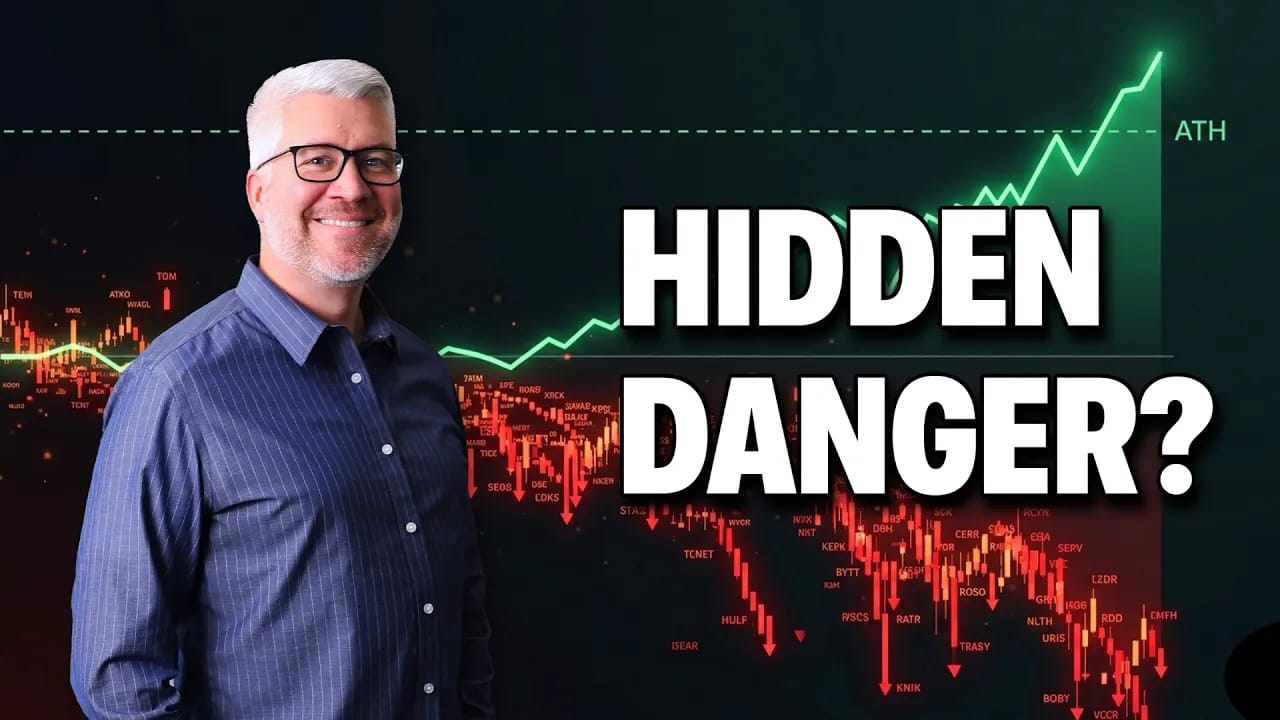
The S&P 500 and Nasdaq 100 continue pushing to new all-time highs, but beneath the surface, classic market warning signals are starting to emerge. Dave breaks down the Hindenburg Omen and Titanic Syndrome—two breadth indicators designed to identify conditions often seen near major market tops—and explains why recent signals deserve attention. Using the StockCharts platform, Dave walks through how these indicators are calculated, how to track them using alerts and breadth data, and why they work best as early warning systems rather than standalone sell signals. Dave also explains how to combine breadth analysis with trend-following tools and momentum indicators to better manage risk during a strong bull market phase.
This video premiered on May 27, 2026. Watch on StockCharts' dedicated David Keller page!
Previously recorded videos from Dave are available at this link.