Record Highs, Fading Momentum: Is the S&P 500 Due For a Pause?

Key Takeaways
- The S&P 500, Nasdaq, and Dow closed at record highs, although momentum is showing signs of slowing.
- The S&P 500 is still healthy, with key short-term support near the 13-day exponential moving average and possibly the 9-day EMA if the rally continues.
- Crude oil has broken below a consolidation pattern, but its move is dependent on whether the U.S. and Iran reach an agreement.
The S&P 500 ($SPX) barely budged on Wednesday, but that didn’t stop the index from closing at another record high. The Nasdaq Composite ($COMPQ) and Dow Jones Industrial Average ($INDU) also closed at record levels. Meanwhile, crude oil prices and Treasury yields moved lower.
A closer look at the S&P 500 chart shows momentum easing a bit. The Relative Strength Index (RSI), shown below the price chart, and the Percentage Price Oscillator (PPO), shown in the lower panel, suggest the rally is losing some steam. This could be because it’s right after Memorial Day weekend, which often marks the unofficial start of slower summer trading.
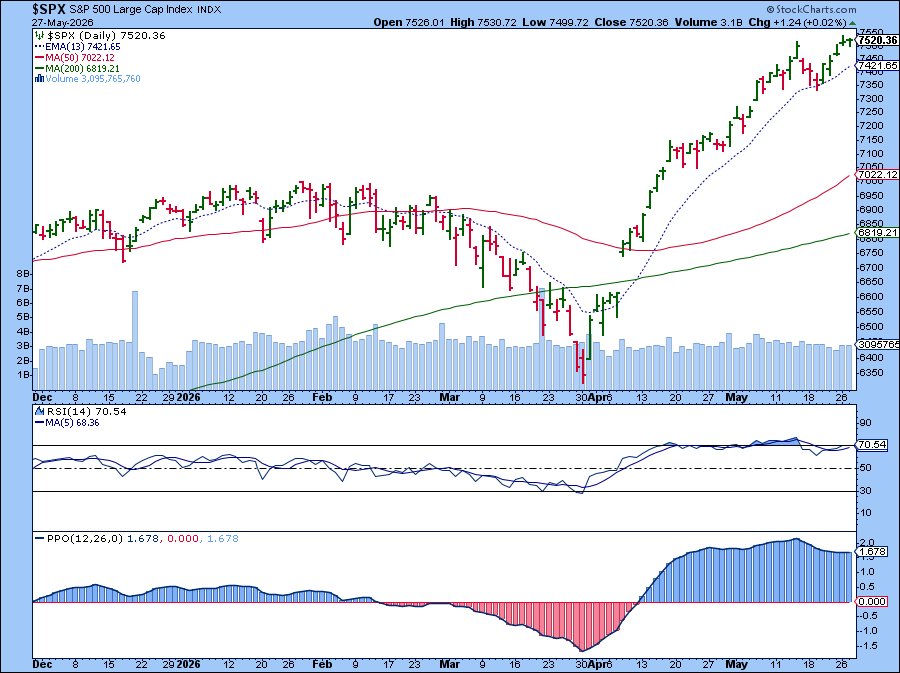
Still, the market doesn’t close for the summer, so the S&P 500 deserves a closer look. Wednesday’s gain was just +0.02%, which, after Tuesday’s gap higher, felt like the move lacked follow-through. Even so, the index is still holding up. Wednesday’s low came in around the same area as Tuesday’s low, which coincides with the May 14 close.
From a technical standpoint, there are no clear signs of deterioration despite the slowdown in momentum. Investors may be waiting for a breakthrough in the U.S.-Iran negotiations, which could give stocks another lift. But then again, some of that optimism may already be priced in.
For now, I’m watching the 13-day exponential moving average (EMA), which is where the index found support on May 19. However, if the S&P 500 rises higher, I would consider tightening that reference point to the 9-day EMA. During the parabolic move off the April lows, the shorter-term average marked several pullback areas.
Crude’s Falling
While stocks continue to inch higher, crude oil prices are moving in the opposite direction. The chart of Light Crude Oil ($WTIC) shows price breaking below the lower boundary of the triangle-like consolidation. The 21-day EMA is trending lower and has just crossed below the 50-day simple moving average (SMA).
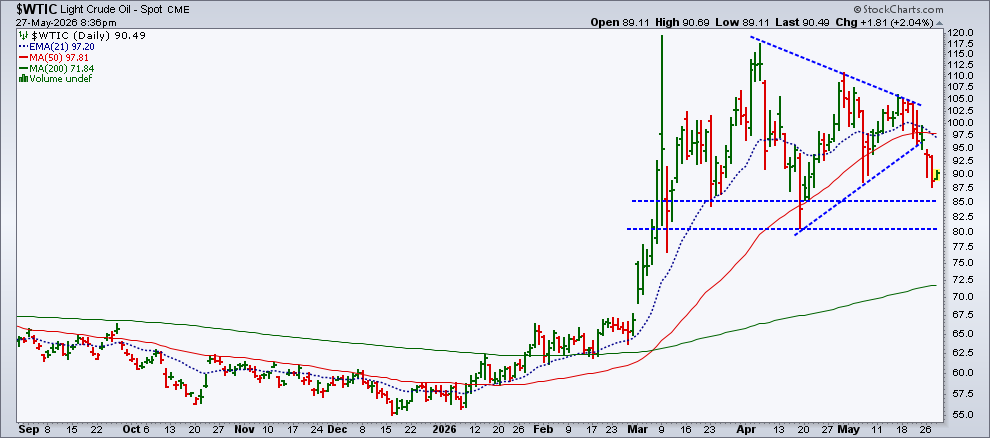
The price action suggests oil may have more downside ahead. The blue dashed horizontal lines mark potential support levels. I’ll be monitoring how price behaves around and below these levels.
The Bottom Line
With investors focused on headlines out of Iran, the market’s tone could shift quickly if there’s no sign of an agreement. If this were the case, I wouldn’t be surprised to see some end-of-week profit-taking. Stocks could pull back, while oil prices could move back up into their triangle range.
Thursday brings several key economic reports, including the April PCE, Durable Goods Orders, and new home sales. If there’s no progress on a U.S.-Iran deal, these reports may not move the needle much, at least judging by recent behavior. Still, they’re worth watching. In an inflationary environment, it’s always useful to keep an eye on Treasury yields. If they move higher, interest rates could stay higher for longer.
The market never stops moving. Make sure you never miss the signals. Subscribe to the free weekly ChartWatchers newsletter.
Disclaimer: This blog is for educational purposes only and should not be construed as financial advice. The ideas and strategies should never be used without first assessing your own personal and financial situation, or without consulting a financial professional.