Week Ahead: Strong Inflows Fuel Rally, Nifty Needs Time to Digest Gains

The Indian equity market surged higher during the week, maintaining a firm upward trajectory and ending with strong gains.
The Nifty began the week on a positive note and sustained its upward momentum through the subsequent sessions, trading in a 703.40-point range; volatility also edged higher, with India VIX rising 3.94% to 16.11. Despite the higher volatility, the benchmark ended the week near its highest point, registering a strong weekly gain of 656.30 points (+2.61%).
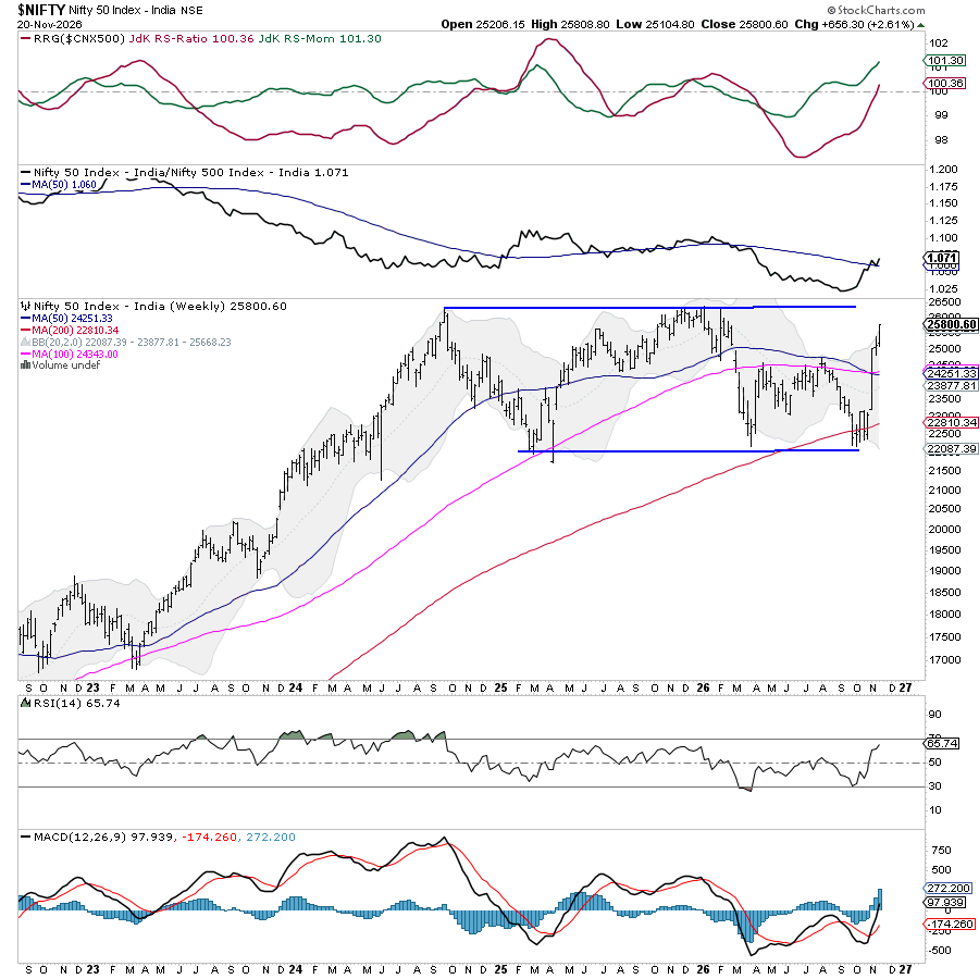
The market’s technical structure has improved significantly after a 3,400-point (14%) rally from recent lows. The Nifty has reclaimed key moving averages and is nearing resistance at its previous highs of 26,000–26,200. Strong FII inflows have lifted sentiment, but the rapid rebound has left the market overheated in the short term, with little consolidation and a sharp gap from intermediate support. Despite a strong broader setup, sideways movement or a controlled pullback would help absorb gains. An uninterrupted rally could raise the risk of sudden corrective jerks.
The coming week is likely to start positively but cautiously. The trading week will also be shortened, as Tuesday, November 24, will be a trading holiday on account of Gurpurab (Nanak Jayanti). The levels of 25,950 and 26,200 are likely to act as immediate resistance points. Support levels are expected at 25,500 and 25,350.
The weekly Relative Strength Index (RSI) stands at 65.74; it has formed a fresh 14-period high, which is bullish. However, it remains neutral and shows no divergence against price. The weekly Moving Average Convergence/Divergence (MACD) is still bullish and above its signal line.
The weekly chart's pattern analysis suggests that the Nifty has staged a decisive rebound of over 3400 points after testing a significant confluence of support near the 22500–23000 zone. This area comprised the 200-week moving average and the lower boundary of a broad consolidation structure that has developed over the past several quarters. The subsequent recovery has taken the Index back above all its key moving averages. However, this also raises the possibility of near-term mean reversion. The broader chart continues to show a large trading range, with the 26,000–26,200 region representing a significant supply zone.
In the coming week, market participants would be better served by balancing the improving technical outlook with the need to protect recent gains. Although strong institutional inflows provide a credible foundation for the ongoing recovery, the market has advanced at a pace that may be difficult to sustain without intermittent pauses. Some consolidation at current levels would be healthy and could help establish a stronger base for a subsequent upward move. Conversely, continued aggressive buying at elevated levels could leave the market vulnerable to abrupt corrective jerks. Traders should avoid chasing extended moves and remain selective in initiating fresh positions. The approach for the coming week should remain cautiously optimistic, highly selective, and focused on protecting accrued gains, rather than aggressively pursuing momentum at elevated levels.
Sector Analysis for the Coming Week
In our look at Relative Rotation Graphs®, we compared various sectors against the CNX500 (NIFTY 500 Index), representing over 95% of the free-float market cap of all the listed stocks.
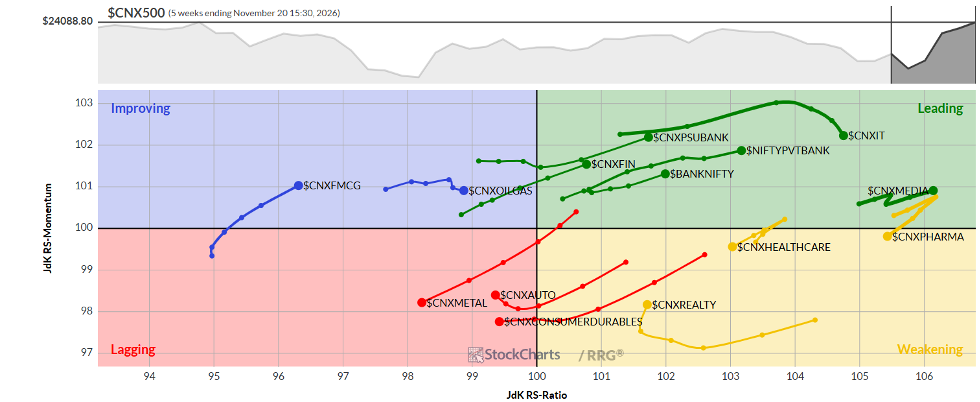
The Relative Rotation Graph (RRG) shows that the Nifty Bank Index, PSU Bank, Services Sector, Media, IT, and Financial Services Sector Indices are inside the leading quadrant. These groups are likely to relatively outperform the benchmark, i.e., the broader Nifty 500 Index.
The Nifty Pharma Index has rolled into the weakening quadrant. While there are individual stock-specific gains, the overall relative outperformance may slow down over the coming days. The Realty Index is inside the weakening quadrant as well, but it’s sharply improving its relative momentum against the broader markets.
The Nifty Metal Index continues to languish inside the lagging quadrant along with the Midcap and Energy Indices. The Nifty Auto Index is also inside the lagging quadrant, but it’s improving its relative momentum against the benchmark.
The Nifty FMCG Index is inside the improving quadrant. The PSE and Infrastructure Indices are also placed inside this quadrant.
Important Note: RRG™ charts show the relative strength and momentum of a group of stocks. In the above chart, they show relative performance against the NIFTY500 Index (Broader Markets) and should not be used directly as buy or sell signals.
Milan Vaishnav, CMT, MSTA
Consulting Technical Analyst
www.EquityResearch.asia | www.ChartWizard.ae