StockCharts Insider: The Titanic Syndrome - A Crash Warning Explained From the Iceberg Up
Before We Dive In…
The evening of April 14, 1912 was moonless and calm in the North Atlantic Ocean. For the crew of the RMS Titanic, it must have felt like a night of smooth sailing. However, the lack of moonlight and waves weighed on the horizon’s visibility. Nobody on board could’ve seen the iceberg ahead. Yet earlier, warnings from six other ships had come in. Some transmissions didn’t get through. But those that did went unheeded. You know the rest of the story.
Three quarters of a century later, on August 25, 1987, the Dow Jones Industrial Average hit a record high of 2,722.42. For many investors, the sentiment leaned “full steam ahead.” As for what happened next, sources and accounts vary. But in a matter of days or weeks, the market started showing quiet signs of internal rot. New 52-week lows on the NYSE were amassing, outnumbering new 52-week highs. The classic Titanic Syndrome started ringing, warning investors to change course. Very few heard it. Those who did largely ignored the warnings and kept their positions sailing. Then came the impact on October 19, 1987. Black Monday.
The Market's Version of the Iceberg
There you have it: a human disaster and a financial disaster named after it. The commonality between the two: everything looks steady on the surface, major risks are hidden underneath, and warnings are ignored.
The market’s name for this signal—the Titanic Syndrome—is based on an indicator designed to detect major risks of this type. Every now and then, you hear the term come up in financial media. It’s not a household concept. But it’s mentioned enough times to explore further.
What is the Titanic Syndrome?
The Titanic Syndrome (!BINYTS1988D) is a breadth indicator developed by market analyst Bill Ohama in 1965. It watches for two things at the same time: The Dow Jones Industrial Average ($INDU) and shares on the New York Stock Exchange (NYSE).
Here’s how it works: When the Dow hits a new 52-week high while more NYSE stocks are hitting new 52-week lows than highs within seven days (before or after), the indicator fires a signal.
Here’s what the signals look like:
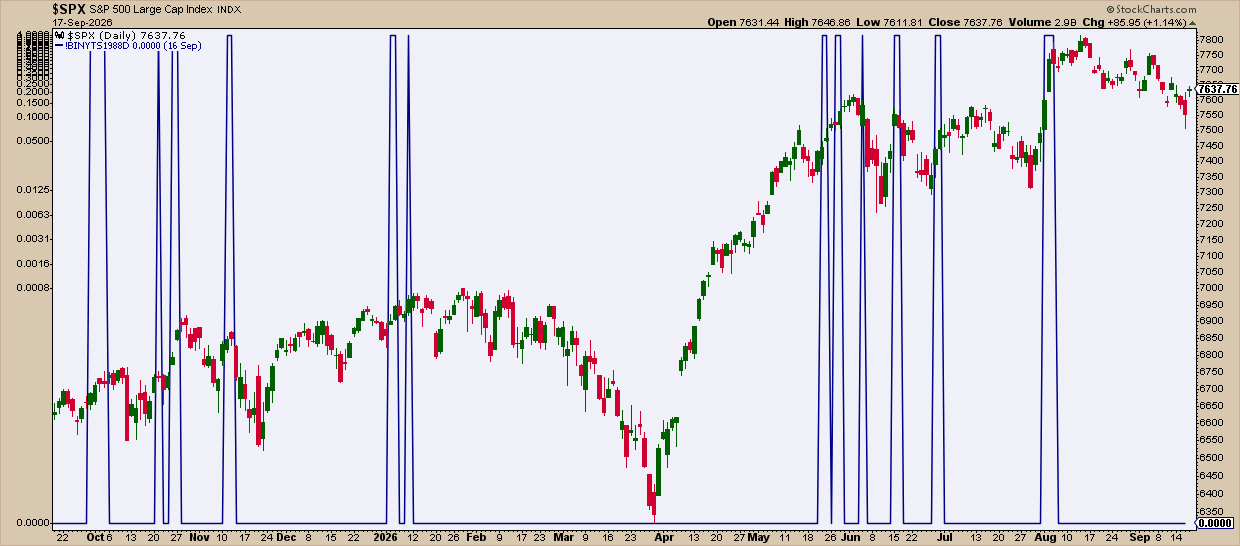
Take a look at the indicator spikes. It’s a binary signal. Either 0, meaning no warning, or >0, a warning trigger. Note how the indicator fires both single warnings and clusters. Also note how some warnings are followed by declines while others miss entirely, giving false positives.
Three Instances Where a Market Iceberg Could Have Been Averted
Hindsight is 20/20. But in these cases, the Titanic Syndrome located a few big crashes ahead of the impact.
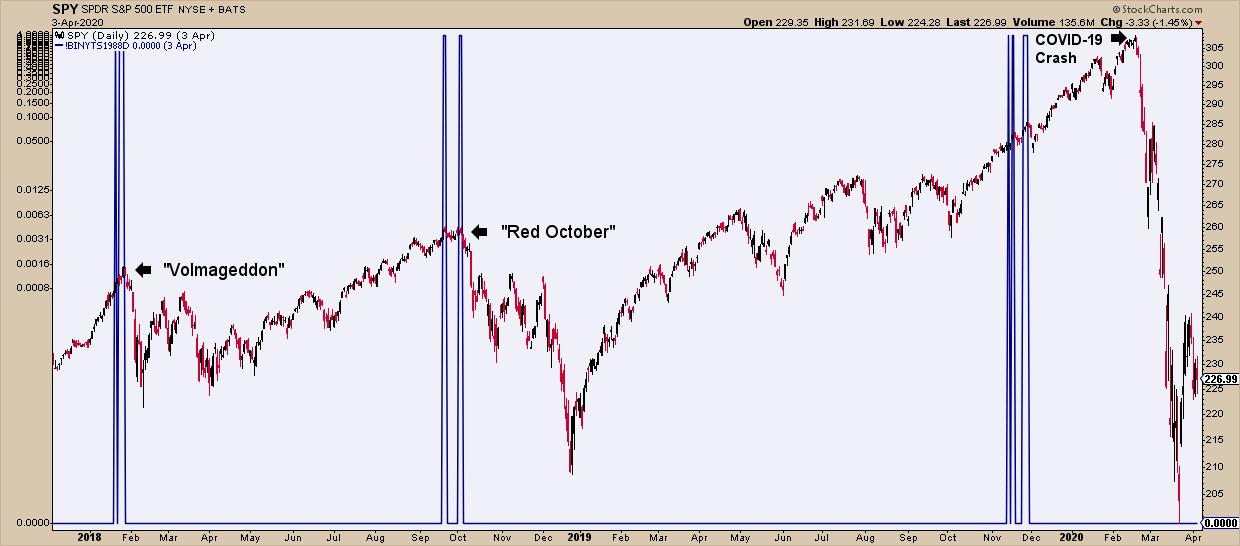
Cluster 1 - February 2018: "Volmageddon"
A spike in inflation fears triggered a bearish chain reaction that decimated complex, short-volatility investment products.The rally looked unstoppable, and most investors probably didn’t see this coming. However the Titanic Syndrome fired its warning just 10 days before the big drop.
Cluster 2 - October 2018: "Red October"
The rally in September looked unstoppable right as the Titanic Syndrome fired its first warnings. Another warning followed around October 2. Then came the synchronized global selloff coined “Red October.” By December 24, the S&P 500 had plummeted nearly 20% from its peak in September.
Cluster 3 - March 2020: The COVID-19 Crash
The first case of COVID-19 didn’t reach American shores until January 2020. But the world was aware of the growing risk that had been spreading exponentially in other parts of the world. It was just a matter of time. Interestingly, the Titanic Syndrome started firing in November and December of 2019. Was it related, or reacting off other events? It’s hard to tell. But the warnings were there.
What It’s Telling You (it’s main value)
The Titanic Syndrome warns you when an index, setting record highs, is rising amid more bearish breakdowns than bullish breakouts. Nevertheless, the indicator isn’t a timing tool. It’s a framing tool. It’s telling you to pay close attention as a decline, unforeseeable as it seems, may crash the rally. By the way, you can find it and other similar indicators in the StockCharts Index Catalog.
Insider Tip #1: Watch for Clusters.
One warning is a reason to be on the lookout. Two or more is an even more compelling reason to be on the lookout. Remember that the Titanic Syndrome is not a timing tool. It provides context, telling you to start thinking of a setup in case things go south.
Insider Tip #2: Try Combining It with the Hindenburg Omen (!BINYHOD).
Both indicators are breadth-divergence signals built on the same underlying logic. When both fire simultaneously, this might indicate a more compelling signal.
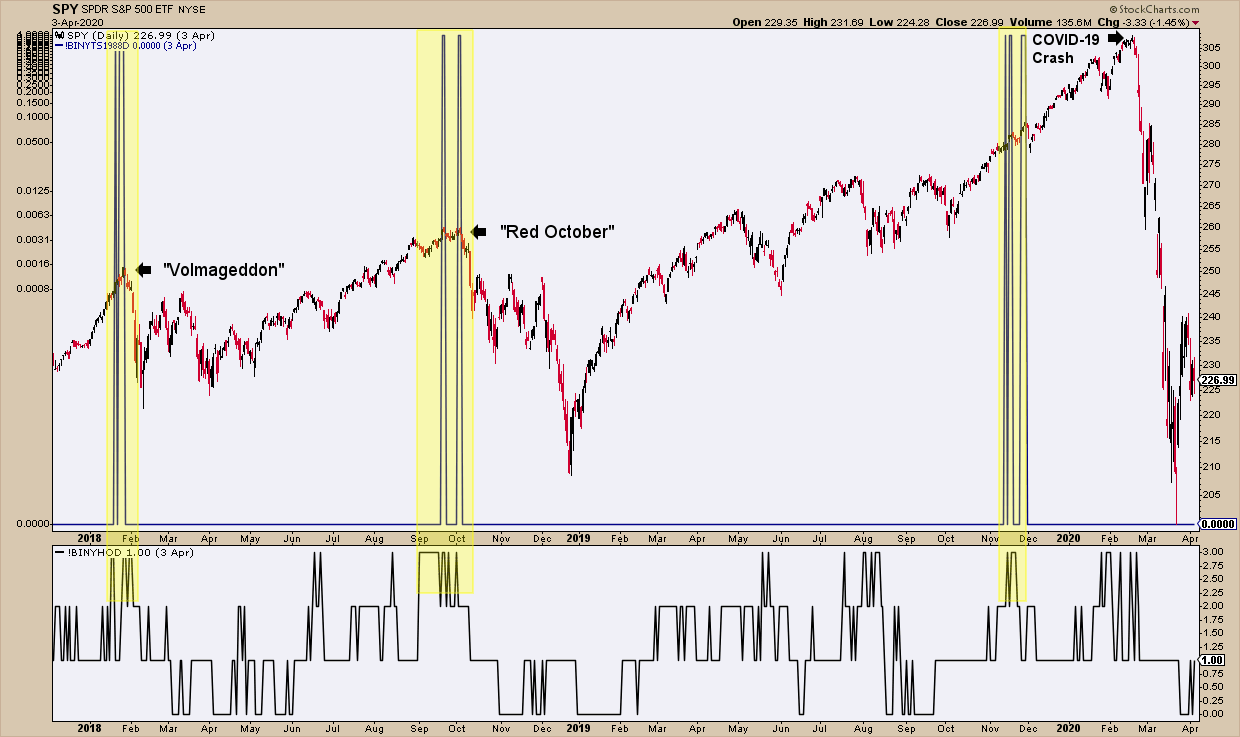
I highlighted areas where warnings from both converged. Remember that either indicator can give off false positives, so be sure you're aware of what’s happening in the markets technically and fundamentally.
And That’s a Wrap
The Titanic had six warnings. Most of them never reached the bridge. The Titanic Syndrome is the market’s version of these warnings. It won’t tell you where the proverbial iceberg may lay in wait, when you might hit it, or even if it’s certain there’s an iceberg at all. But when the Dow is hitting new highs while hundreds of NYSE stocks are breaking down underneath, the indicator will warn you. The rally will be going strong and the “band” will continue to play. But are you looking ahead?