The Best Five Sectors This Week #71
Key Takeaways
- Technology remains the leading sector, with strong performance pushing it higher on price charts and RRG metrics.
- Energy shows signs of weakness with declining relative strength and momentum, and could soon fall out of the top five.
- Industrials and Real Estate exhibit improving trends, with Industrials breaking out and Real Estate stabilizing near resistance levels.
- The cap-weighted portfolio continues to crawl back, narrowing the gap with the S&P 500 to less than 5%.
After a shortened trading week, the S&P 500 ($SPX) closed last Thursday with a gain of nearly 1%. While there were a few shifts in sector rankings, the composition of the top five sectors remained unchanged.
The Top Five Sectors Remain Stable
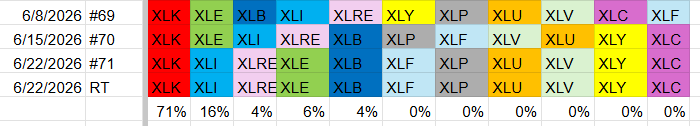
As of last Thursday’s close (with Friday being a holiday), Technology has continued to lead the pack. Industrials climbed from third to second place, while Real Estate moved up from fourth to third. This shift pushed Energy down from second to fourth, while Materials held steady at fifth. Despite these changes in ranking, the top five sectors, Technology, Industrials, Real Estate, Energy, and Materials, remained the same.
In the lower half of the rankings, Financials edged up from seventh to sixth, pushing Consumer Staples down to seventh. Utilities advanced from ninth to eighth, causing Health Care to slip to ninth. Consumer Discretionary and Communication Services remained in tenth and eleventh place, respectively.
- (1) Technology - XLK [71%]
- (3) Industrials - XLI [16%]*
- (4) Real Estate - XLRE [4%]*
- (2) Energy - XLE [6%]*
- (5) Materials - XLB [4%]
- (7) Financials - XLF*
- (6) Consumer Staples - XLP*
- (9) Utilities - XLU*
- (8) Health Care - XLV*
- (10) Consumer Discretionary - XLY
- (11) Communication Services - XLC
Weekly RRG
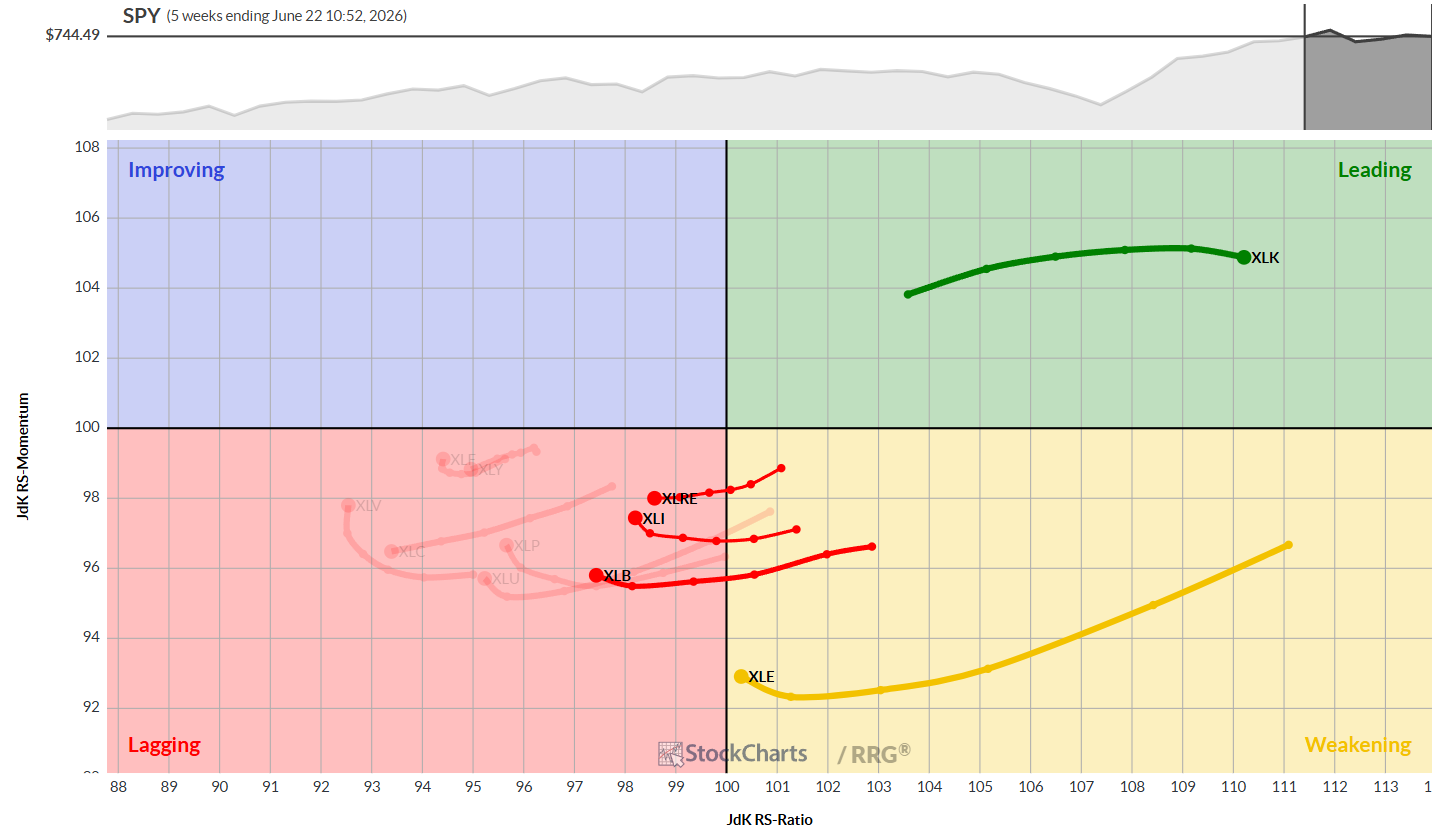
The weekly Relative Rotation Graph (RRG) shows technology (XLK) as the only sector in the leading quadrant. Energy (XLE) remains in the weakening quadrant, close to crossing into lagging territory. Materials, Industrials, and Real Estate are all in the lagging quadrant but are outperforming other sectors within that group. Notably, no sector currently sits in the improving quadrant on the weekly RRG.
Daily RRG
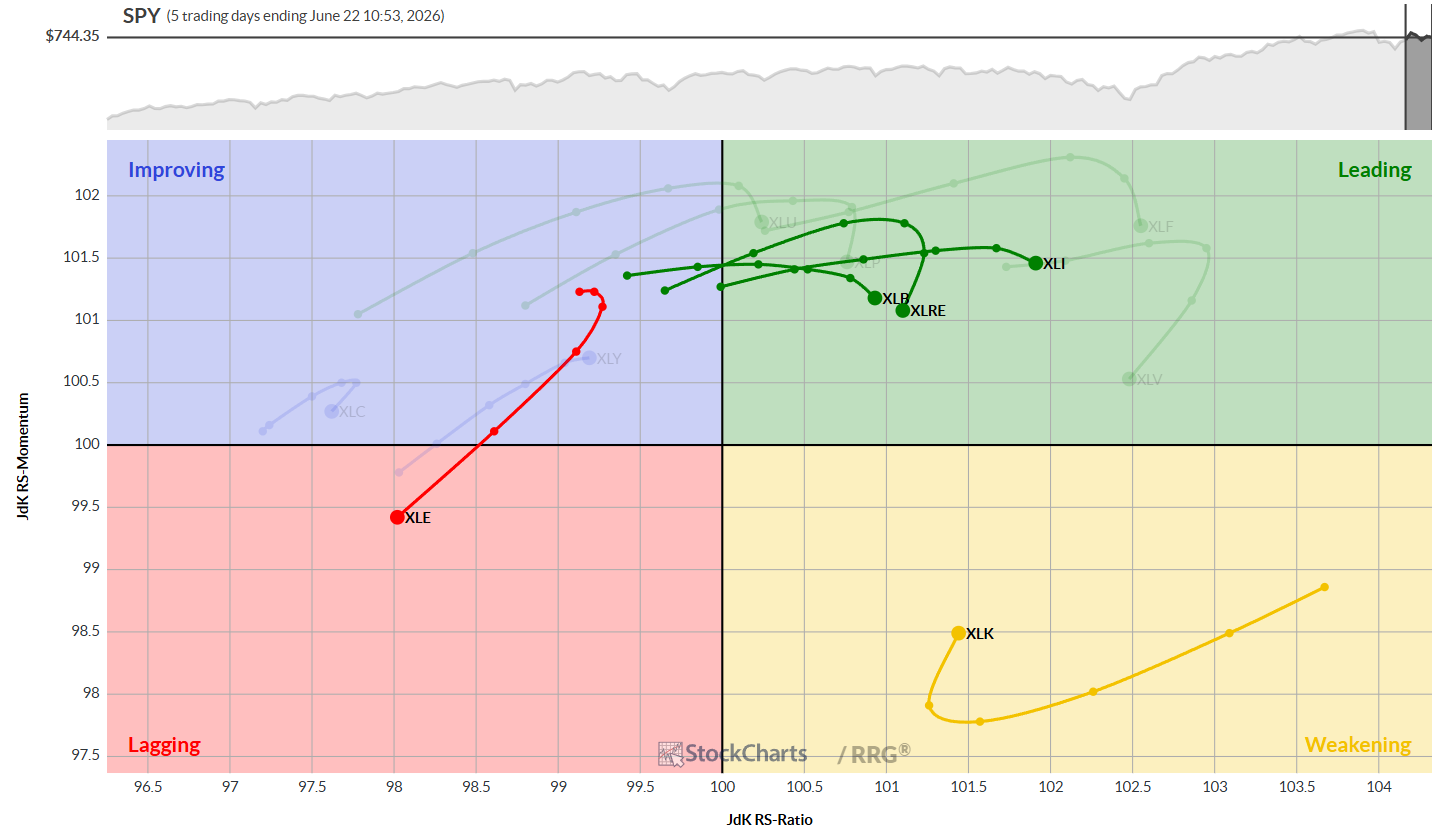
On the daily RRG, Technology (XLK) is showing renewed strength, curling back up inside the weakening quadrant and heading back toward leading. Materials, Industrials, and Real Estate are in the leading quadrant, though Real Estate is starting to lose momentum. Materials and Industrials continue to rise on the RS Ratio scale, albeit with some loss of momentum. Energy (XLE) has rotated through lagging, improving, and back to lagging, which is a negative sign, especially as its weekly position is close to entering the lagging quadrant. Energy is a sector to watch closely in the coming weeks.
Sector Highlights
Technology
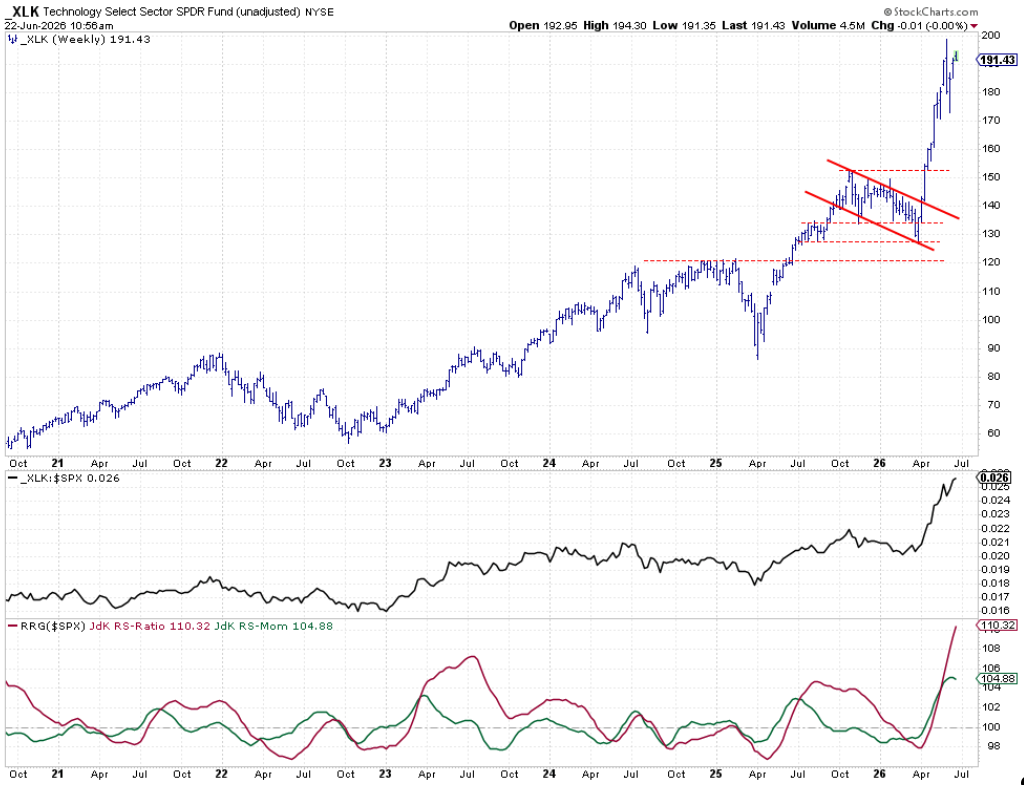
The technology sector continues to push higher, challenging recent highs on both the price and relative charts. This ongoing momentum keeps technology firmly at the top of the rankings.
Industrials
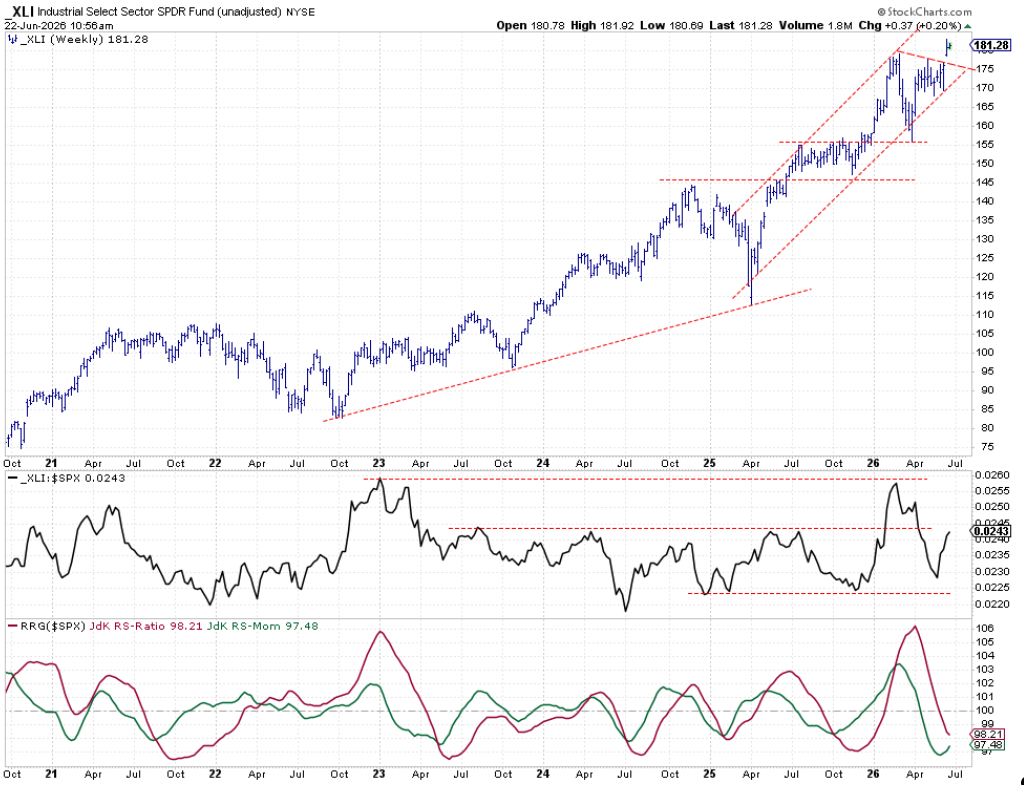
Industrials are holding up well after breaking out of a consolidation pattern and remain within a rising channel. The sector’s raw relative strength (RS) line is rebounding, and RS momentum is starting to turn upward, signaling potential further improvement.
Real Estate
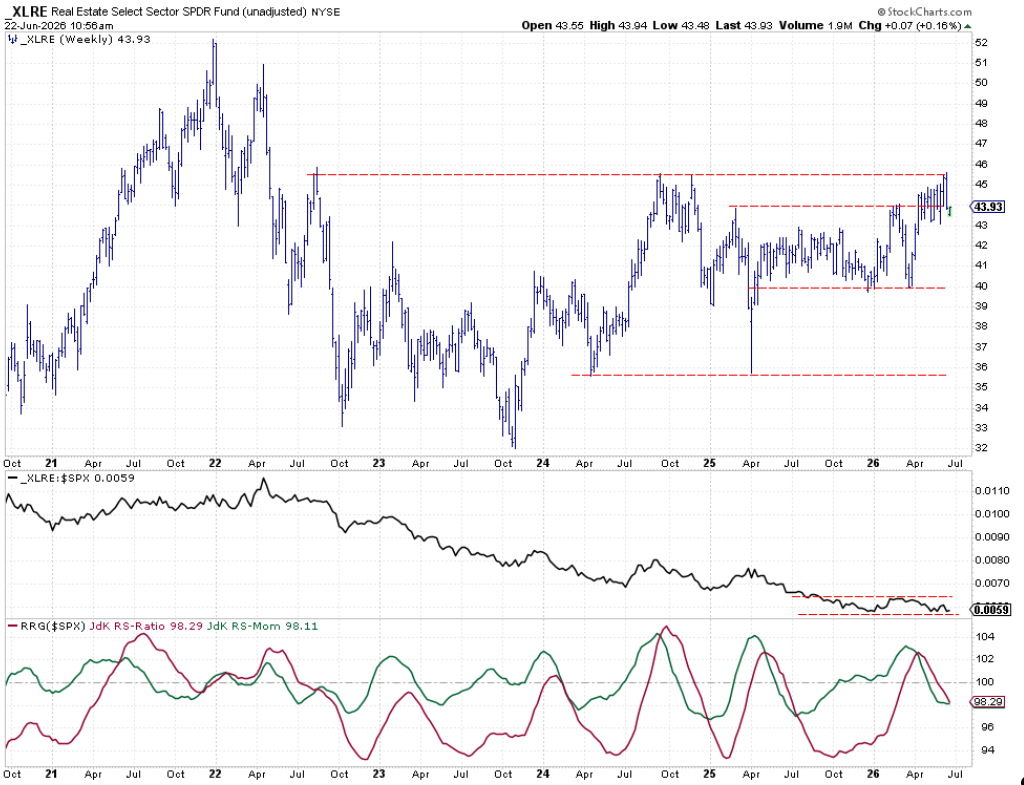
Real estate (XLRE) is testing resistance just above 45, with support at 43. The sideways price movement has stabilized the raw RS line after a long decline, and a horizontal support level appears to be forming. If this trend continues, it could confirm a positive outlook for real estate on the RRG.
Energy
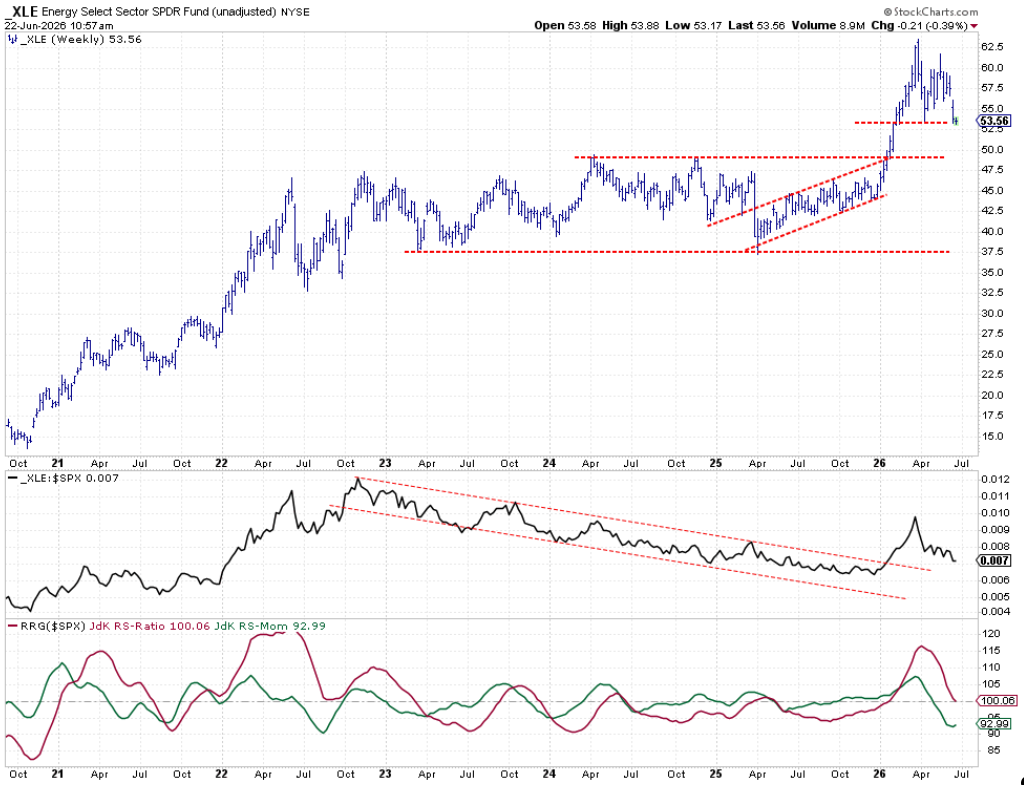
The energy sector recently broke lower from a small triangle formation and is now resting at support around 53–53.50. If this support fails, the next level is just below $50. The raw RS line is trending lower, and the RS-ratio is about to cross below 100, which would place XLE firmly in the lagging quadrant. Energy’s relative momentum is a concern, and the sector could drop out of the top five if this trend persists.
Materials
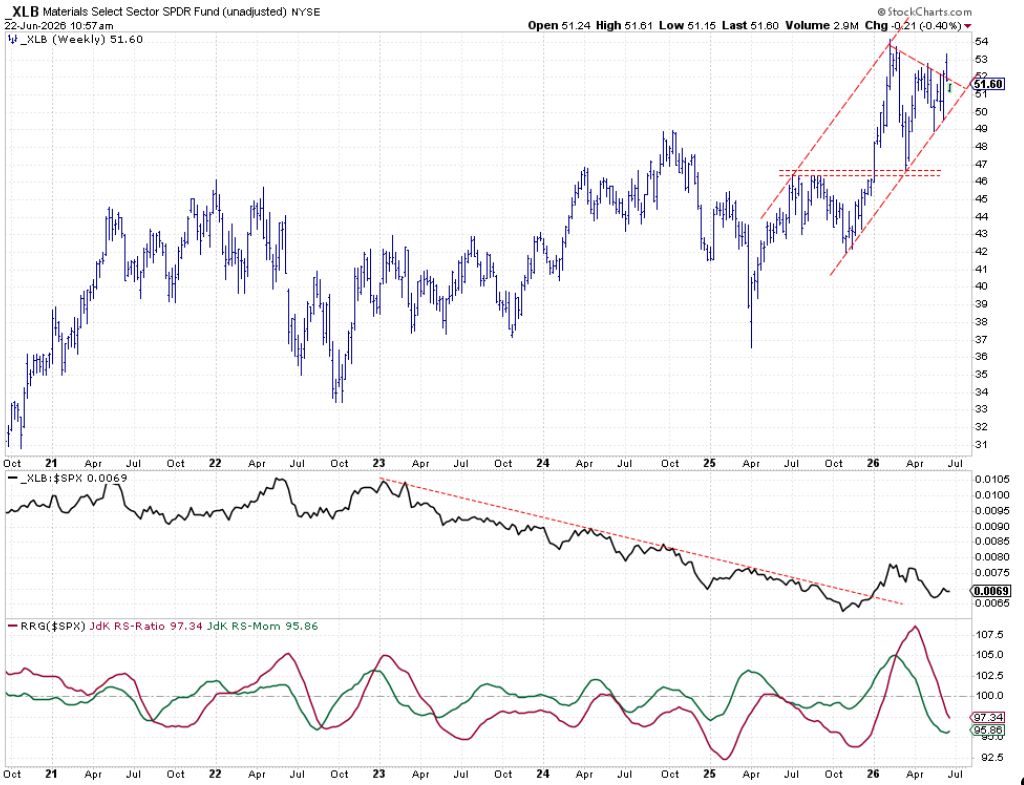
Materials have slipped back into a consolidation pattern, confirming resistance just above 53.50. The price remains within a rising channel while the raw RS line has established a higher low. The RS momentum has leveled off, and further relative strength is needed to push materials into the improving or leading quadrants and maintain its top-five status.
Portfolio Performance Update
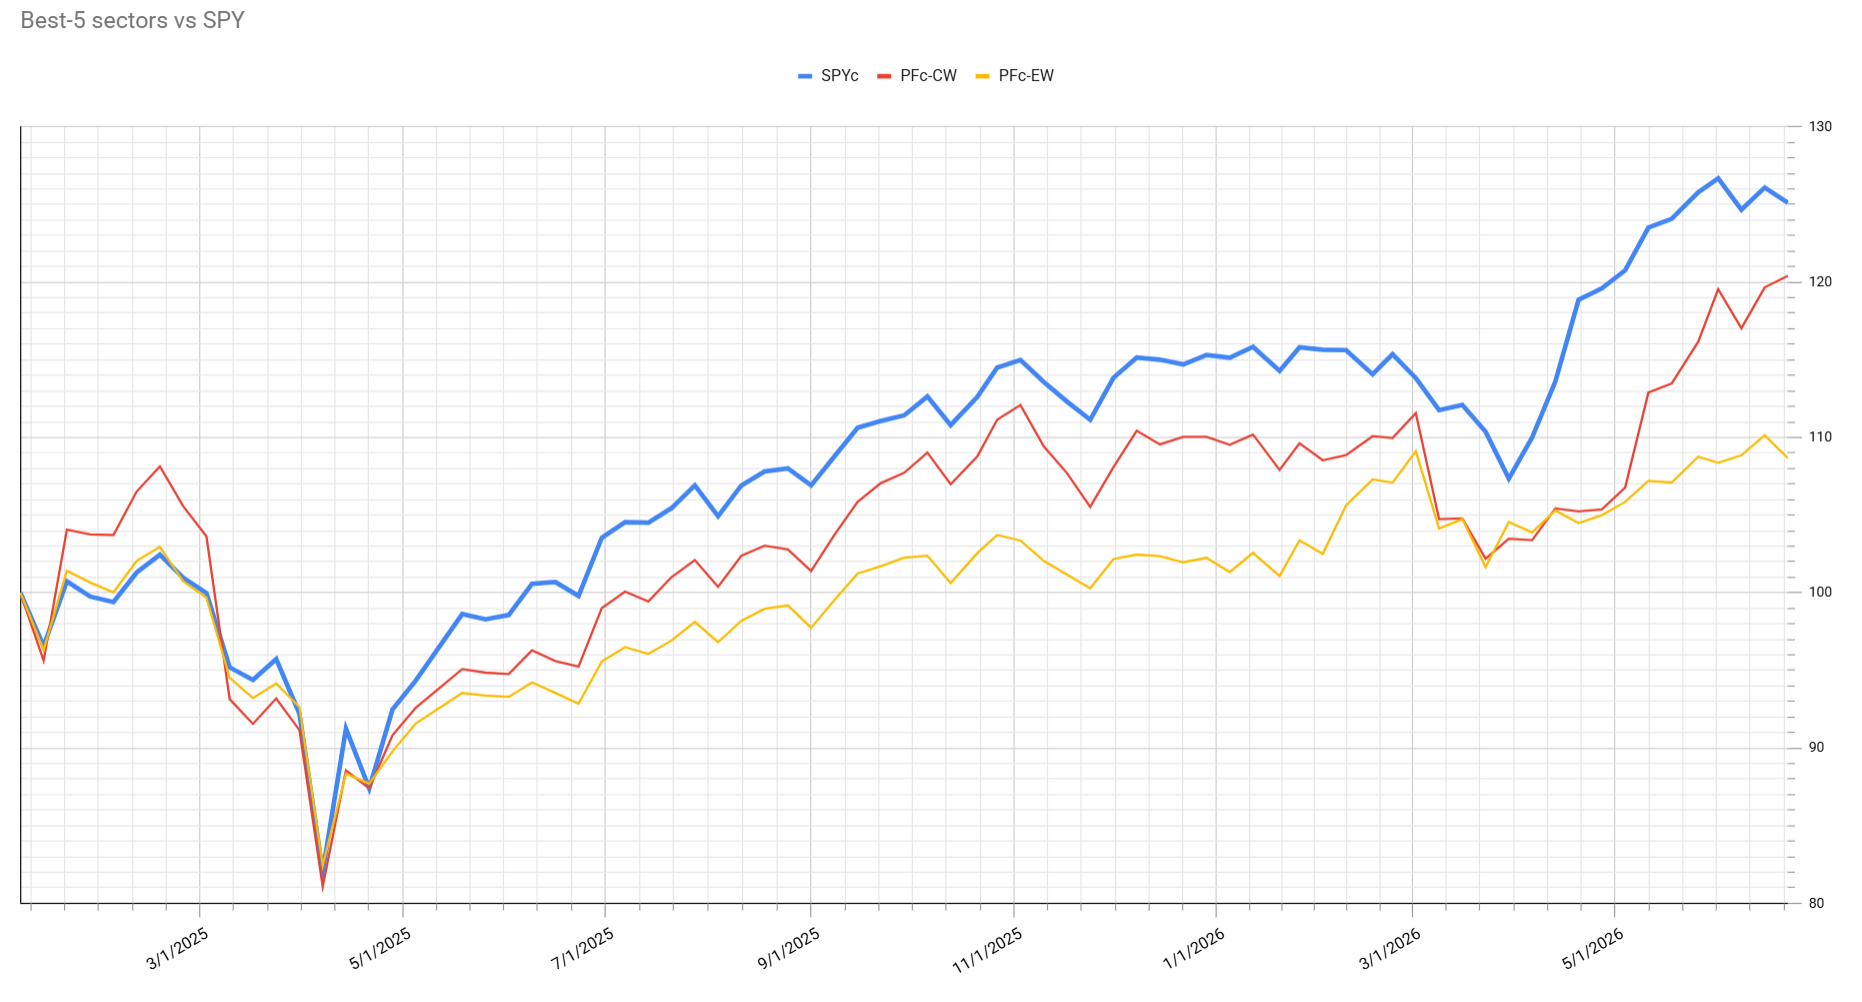
Thanks to strong performance in the technology sector, the cap-weighted portfolio’s performance continues to crawl back, narrowing its gap with the S&P 500 to less than 5% at the end of last week. Earlier in this new week, some gains were given back due to weaker technology performance, but the focus remains on end-of-week results before drawing conclusions from that. The portfolio’s recovery continues, and ongoing monitoring will reveal if it can eventually outperform the S&P 500.
#StayAlert, Julius