Tech’s Former Leaders Are Cracking: What Comes Next for the Mag 7?
Key Takeaways
- Volatility has kicked up in the Nasdaq 100 as mega-cap growth names stumble and dip further into correction territory.
- I see more downside ahead, but seasonality is (for the moment) on the bulls’ side.
- Amid a rising-dollar backdrop, other size factors, styles, and industries are likely to keep working.
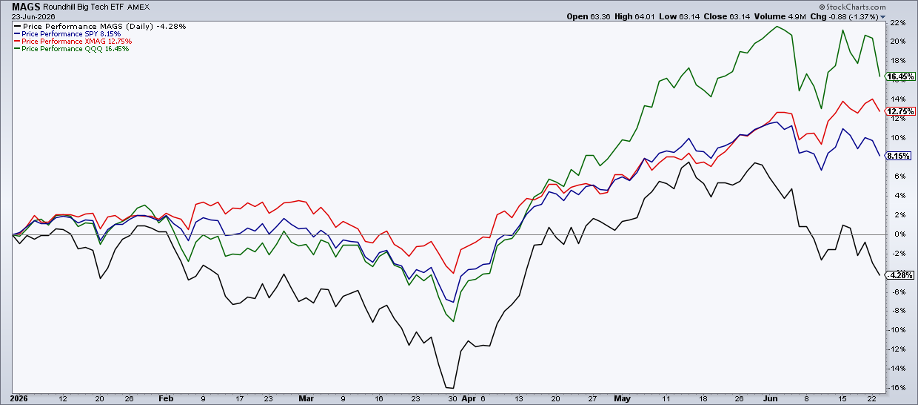
The Magnificent Seven just aren’t that magnificent anymore. The Roundhill Big Tech ETF (MAGS) is down 4.3% on the year, lagging the S&P 500 by more than 12 percentage points.
The fund, which holds equity and derivatives stakes in well-known U.S. tech and tech-related glamour stocks, also trails the Invesco Nasdaq 100 ETF (QQQ) by more than 20 percentage points YTD.
Tech’s Babyfaces Turn Heel
Now in correction territory off its May 14 peak above 71, the market’s former all-stars have given way to smaller and hotter AI plays. Drawdowns for the Mag 7 include Apple’s (AAPL) 7% decline from its 52-week high, all the way down to Meta Platforms (META) and Microsoft (MSFT), which have shed about 30%, respectively.
Even the newly minted Dow Jones Industrial Average member Alphabet (GOOGL), seen as a diversified and more vertically integrated AI leader, is 14% below its record high from the middle of the quarter.
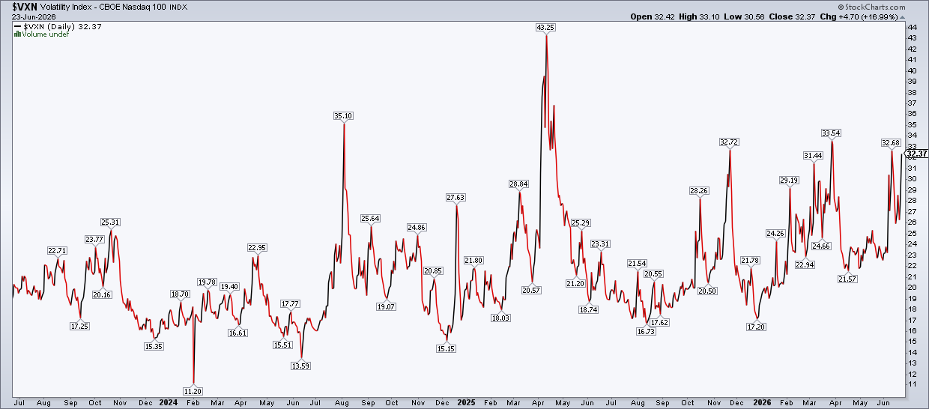
Nasdaq Vol > 30
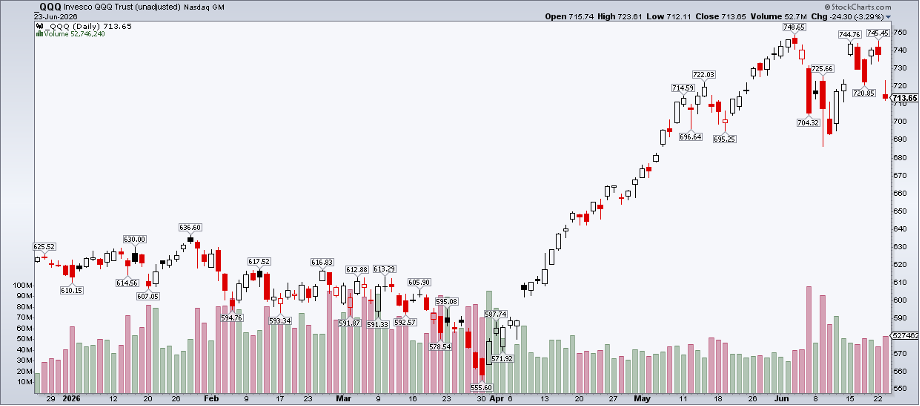
Amid Mag 7 malaise, QQQ’s chart has turned ominous. A looming double-top pattern emerges, with the bears staking their claim in the $745–$748 range. What’s more, the Cboe Nasdaq 100 Volatility Index (VXN) is within earshot of a 14-month high. Lesser-known than the Cboe Volatility Index (VIX), which gauges 30-day annualized implied volatility on the S&P 500, VXN tends to run hotter and is increasingly Mag 7-driven.
Earnings season for U.S. tech megacaps is still a month away, and technical trouble may be brewing for the Mag 7 and broader tech. Let’s start with MAGS.
Technical Cracks on MAGS
Notice in the chart below that MAGS has fallen below its long-term 200-day moving average. It’s a negative cue, for sure, but that trend-indicator line remains upward-sloping, which is a positive for the bulls. What’s more, the shorter-term 50-day moving average remains above the 200-day moving average, so there is no bearish death cross yet.
Below the most recent settle, I spot a pair of lingering price gaps, spaced just a handful of days apart. The first comes into play just below $62. The second, from April 8, is near $58.30. Some assert that all gaps get filled; I don’t buy into that logic, but these are certainly downside targets to monitor.
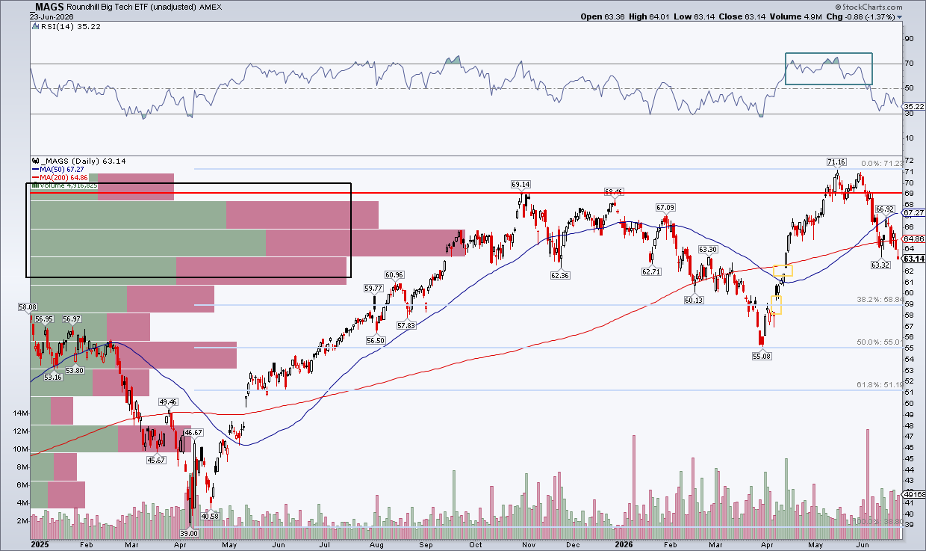
Momentum Rolls Over
Also, look at the RSI momentum oscillator at the top of the chart. Price and momentum looked good in mid-May when tech and the Mag 7 dominated coming off the March 30 S&P 500 low. MAGS tagged a record above $71 just as the oscillator rose above 70, confirming the advance.
But that gain proved to be a bearish false breakout, with price failing to notch a new record later in the month, then falling below the prior peak near $69 from last October. Today, with a high amount of volume-by-price up to about $70, the bulls have plenty of wood to chop this summer.
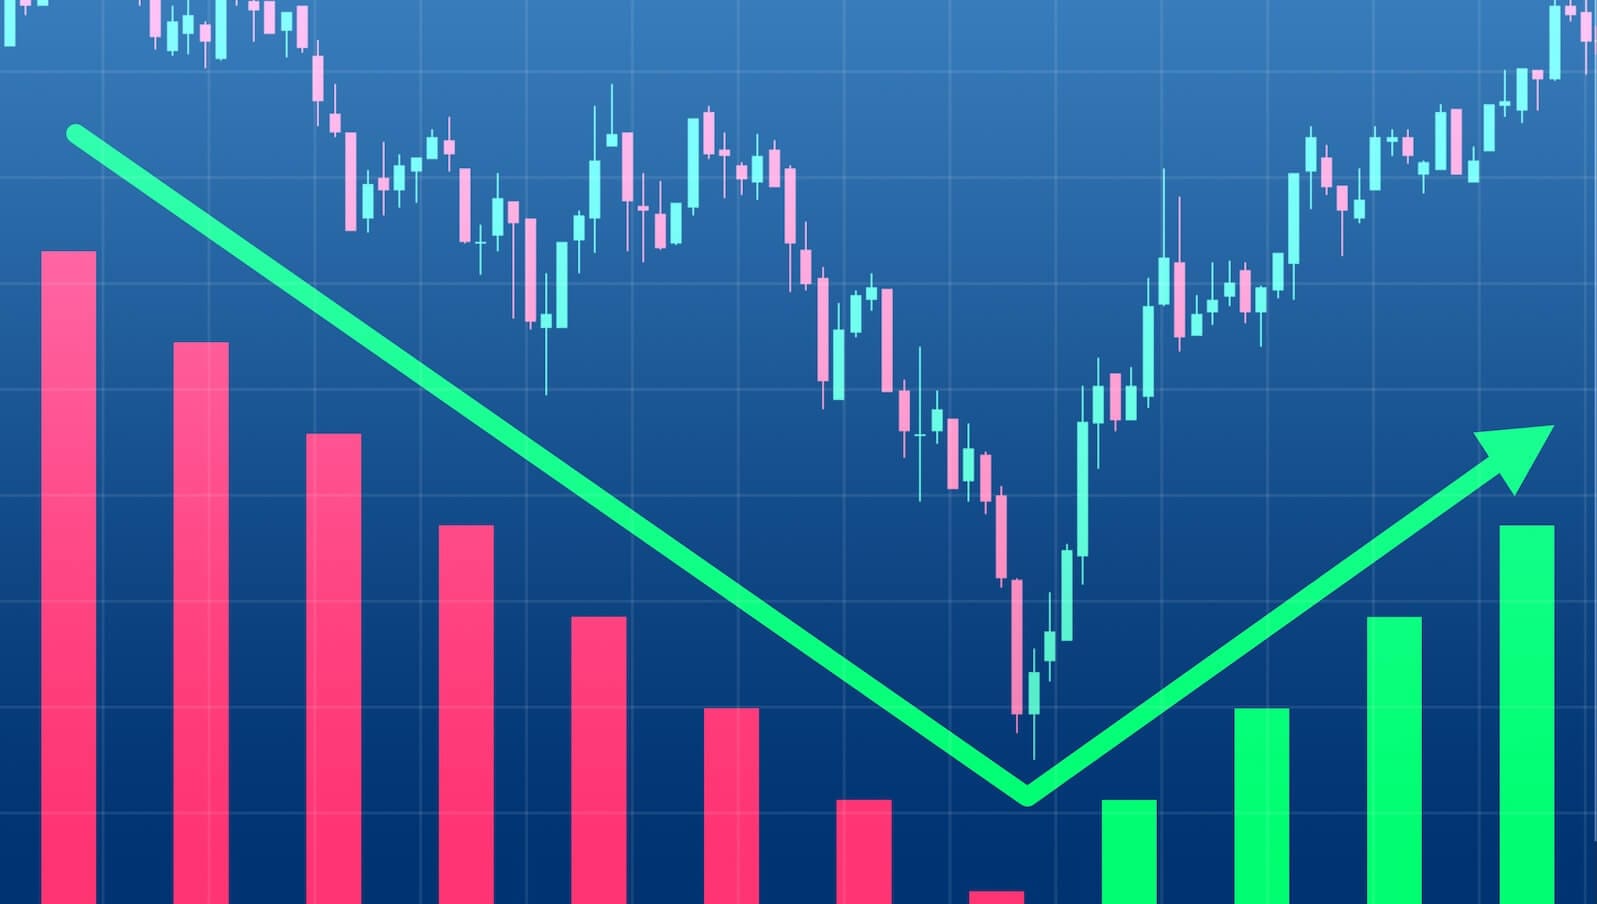
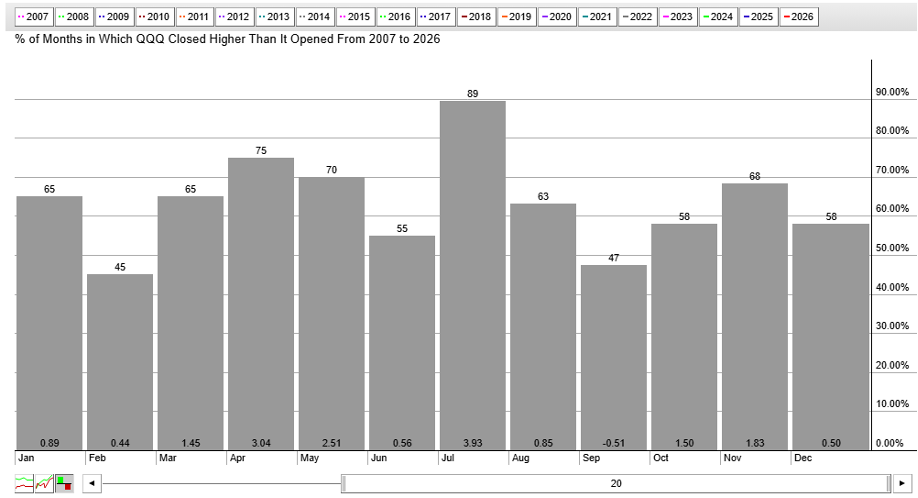
A Calendar Tailwind for Megacap Tech
The good news is that the first half of July has been incredibly bullish in recent years, going back to 1950 on the SPX. After that, annual calendar trends turn dicey, and the midterm election-year stretch from August through mid-to-late October notoriously features corrective price action.
In the here and now, I would not be surprised to see MAGS retreat to fill the first gap and then threaten the second, as the 38.2% Fibonacci retracement of the April 2025 to May 2026 rally enters the scene near $59.
Bigger picture, the SPX has done a whole lot of nothing since mid-May. It reminds me of the period from last October through February. “Broadening” was the zeitgeist and, while U.S. large caps and tech struggled, other areas (value, SMIDs, ex-U.S.) picked up the slack. Volatility remained elevated, but diversification was the allocation antidote.
All of this comes with the macro backdrop of a stronger dollar and falling oil, a different situation compared to four to five months ago. No two periods are alike, but we can use intermarket analysis to help generate alpha in the current nuanced regime.
Discovering Plays Beyond Big Tech
Right now, I’m impressed with the outperformance of areas that would normally succumb to dollar strength and stubbornly high real Treasury yields. While international stocks stumbled earlier this week as the greenback soared, a long-term bull market appears to be in place in, say, the Vanguard FTSE All-World ex-US ETF (VEU). At home, the Russell 2000 Index reached 3000 for the first time back on Monday. More granular, regional banks and REITs don’t seem to mind the supposedly hawkish Fed. Those could be second-half winners, particularly if the Mag 7 maelstrom turns more severe.
Among my favorite resources when eyeing alpha pockets is the “Dow Industries” tab on the StockCharts Market Summary page. You can rank by SCTR score to identify the areas with the strongest relative strength.
Earnings Season Ahead: Watch Price Action, Not EPS
As mentioned earlier, the late July earnings stretch for five of the seven will be key... not so much because of the revenue and profit numbers themselves, but because of how shares react. Another leg lower following a July recovery would make seasonal sense. If that’s the case, a U.S. large-cap defensive posture could be the play heading into election season.
The Bottom Line
The Mag 7 stocks remain under pressure. Now in technical correction territory, the group’s struggle has resulted in QQQ weakness and a near-52-week high in the Nasdaq Volatility Index. Traders could consider pressing shorts there, but they can also look beyond mega-cap tech for alpha opportunities.
Disclaimer: This blog is for educational purposes only and should not be construed as financial advice. The ideas and strategies should never be used without first assessing your own personal and financial situation, or without consulting a financial professional.