Gold is Breaking Out Again. Is a New Uptrend Beginning?

After an absolutely stunning run of outperformance in 2026, where gold outperformed both the S&P 500 ($SPX)and the Nasdaq 100 ($NDX), the yellow metal has spent much of 2026 lagging behind the major equity averages. While some questions remain, we see the recent upturn as evidence of a potential new accumulation phase for gold.
Today, we’ll break down a phased approach for analyzing gold, review nuances with gold ETFs, and highlight one gold miner that has moved above a key resistance level.
Gold Has Entered an Accumulation Phase
Off a multi-year high in January, the SPDR Gold Shares (GLD) entered into a distribution phase, marked by lower lows and lower highs in price. The RSI also remained mostly below 50 during this period, accentuating the weaker momentum characteristics.
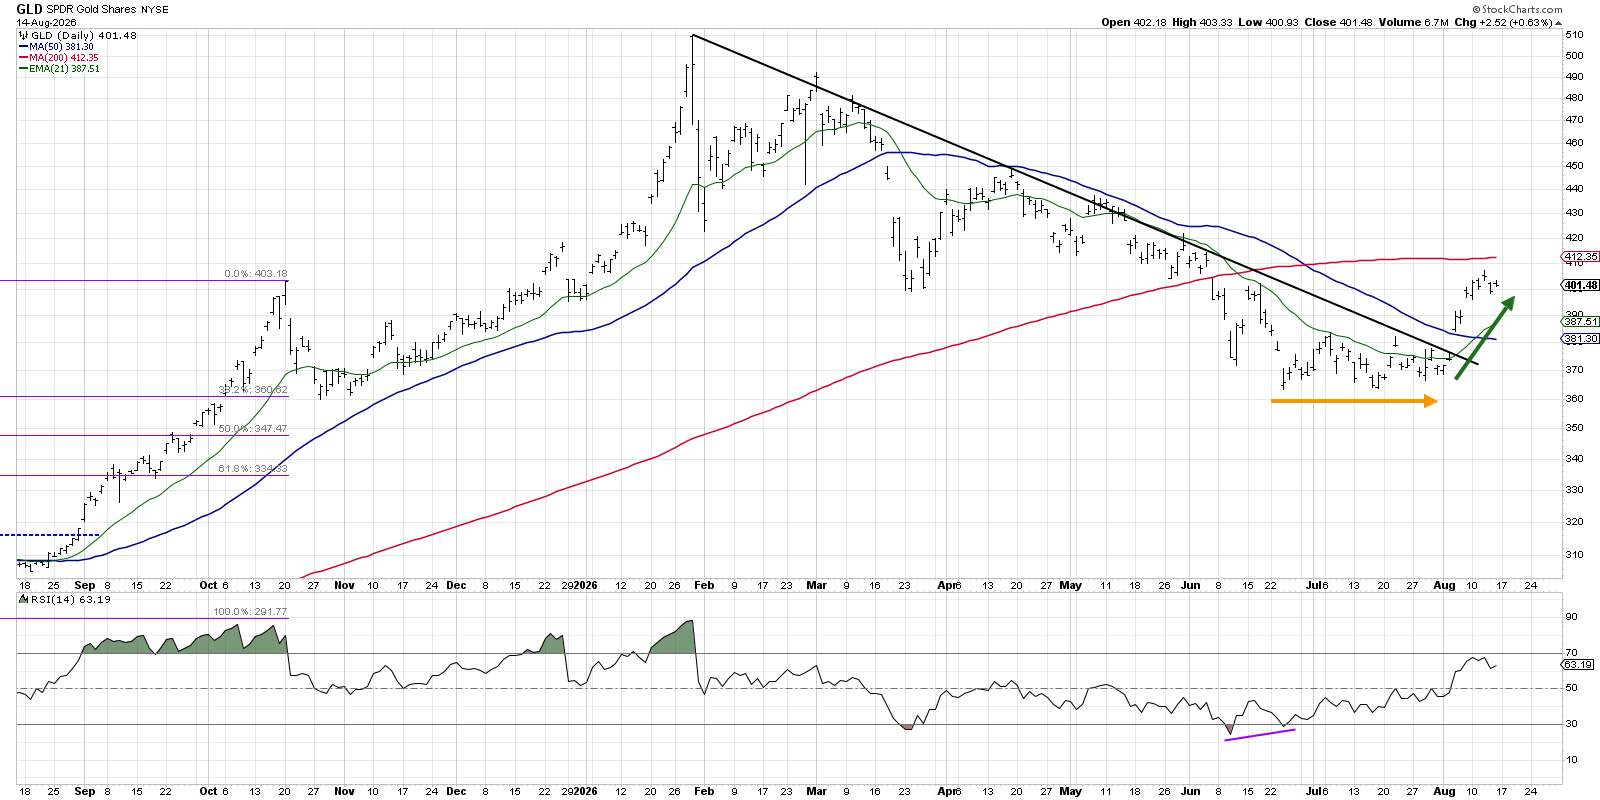
Once GLD reached $365 in late June, the ETF bounced off that support level through the end of July. We considered this period a consolidation phase, featuring consistent support and resistance levels and sideways price action. Earlier this month, the gold ETF finally completed a valid breakout above key trendline resistance, signaling the beginning of a new accumulation phase.
On the GLD chart, it’s worth noting the bullish momentum divergence in June, with lower price lows matched with improving momentum readings. When the price is still going lower, but the Relative Strength Index (RSI) starts to slope back higher, this can often indicate a downside exhaustion point.
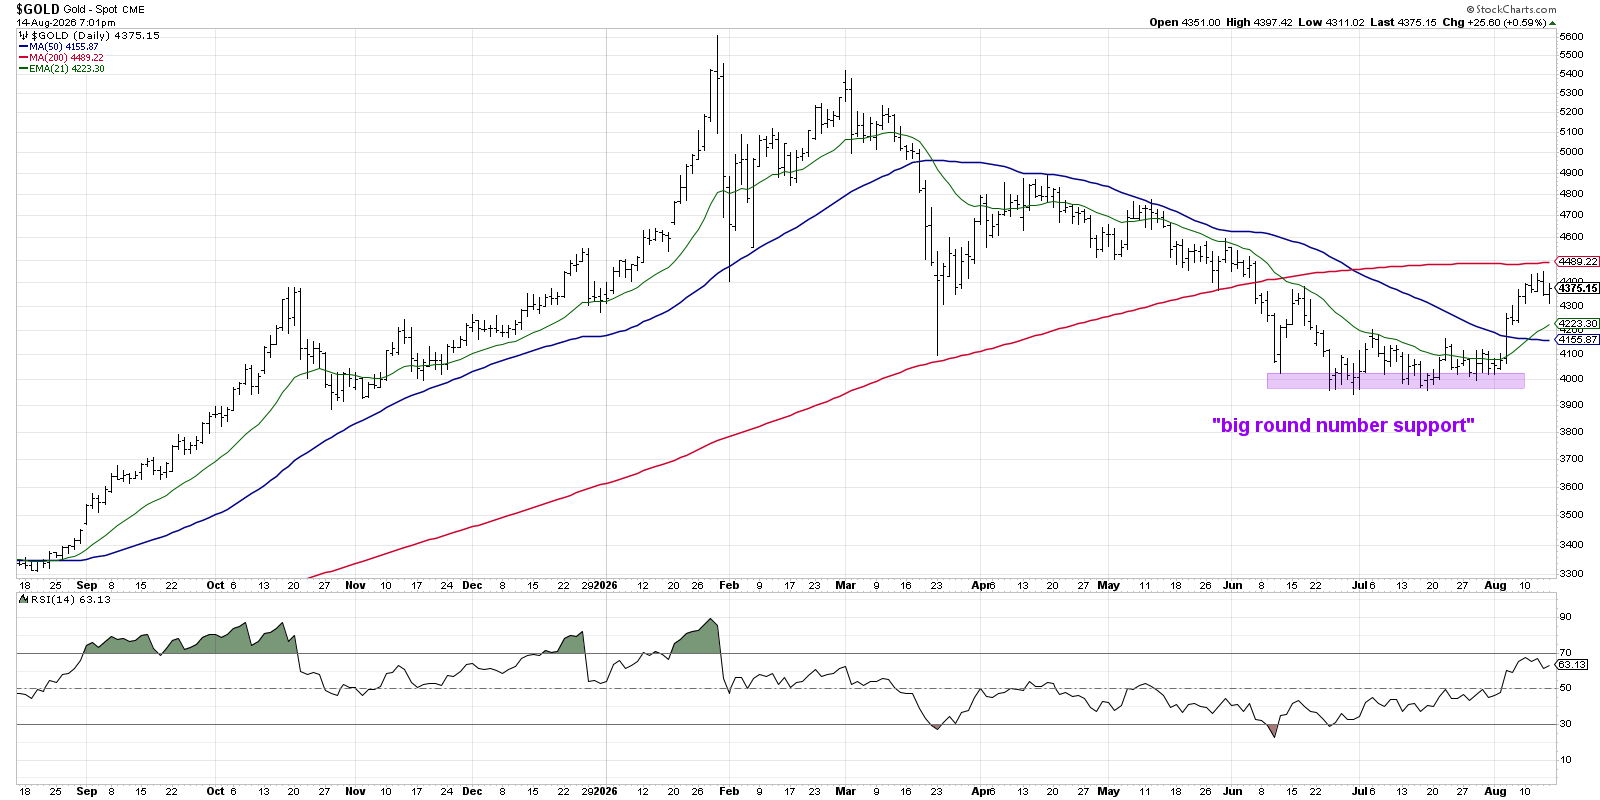
Looking at the gold futures, we can recognize that the support levels in June and July were right around $4000/oz. Stocks, ETFs, and commodities will often respect “big round number” support levels, perhaps because of the psychological meaning of the value. In any case, both charts demonstrate a strong advance off a well-established low.
Gold Miners Have Begun to Outperform
Given the upturn in gold prices, it’s not surprising that gold mining stocks have also entered into a new uptrend phase. The VanEck Gold Miners ETF (GDX) has not only broken above trendline resistance, but has also pushed back above the 200-day moving average.
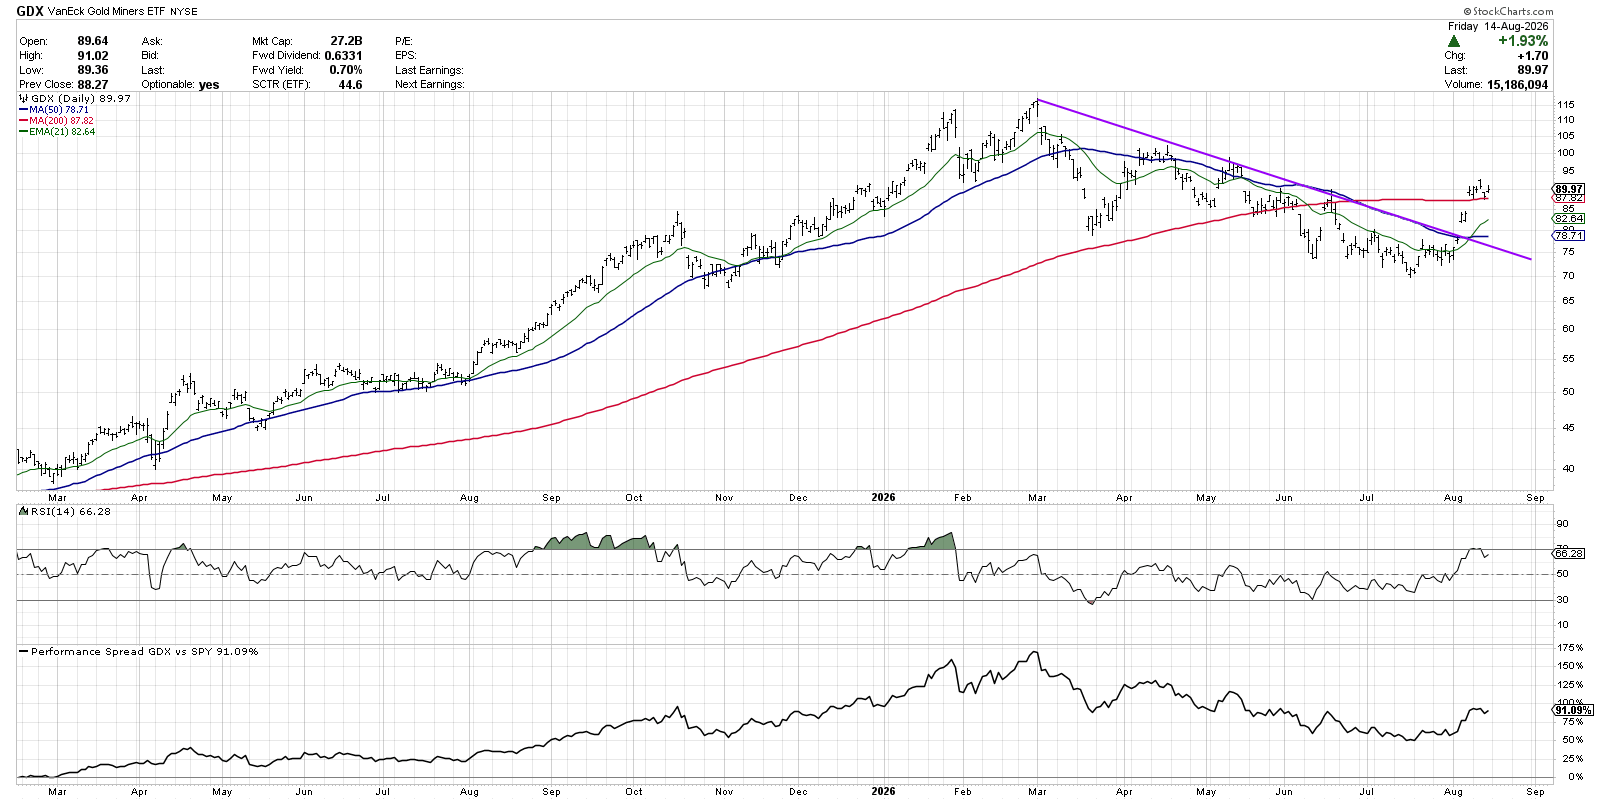
When GDX pushed above key trendline resistance, the price also pushed above the 50-day moving average. Over the next couple trading sessions, gold miners accelerated to the upside with higher RSI levels, implying better price momentum. The relative strength has also improved over the last month, as indicated by the Performance Spread indicator in the bottom panel.
Agnico Eagle Mines (AEM) Broken Above Key Resistance
The correlation between gold miners is usually pretty high, as they are all driven primarily by the price of spot gold. Among the gold miners, Agnico Eagle Mines (AEM) stands out because it has pushed above a “confluence of resistance”.
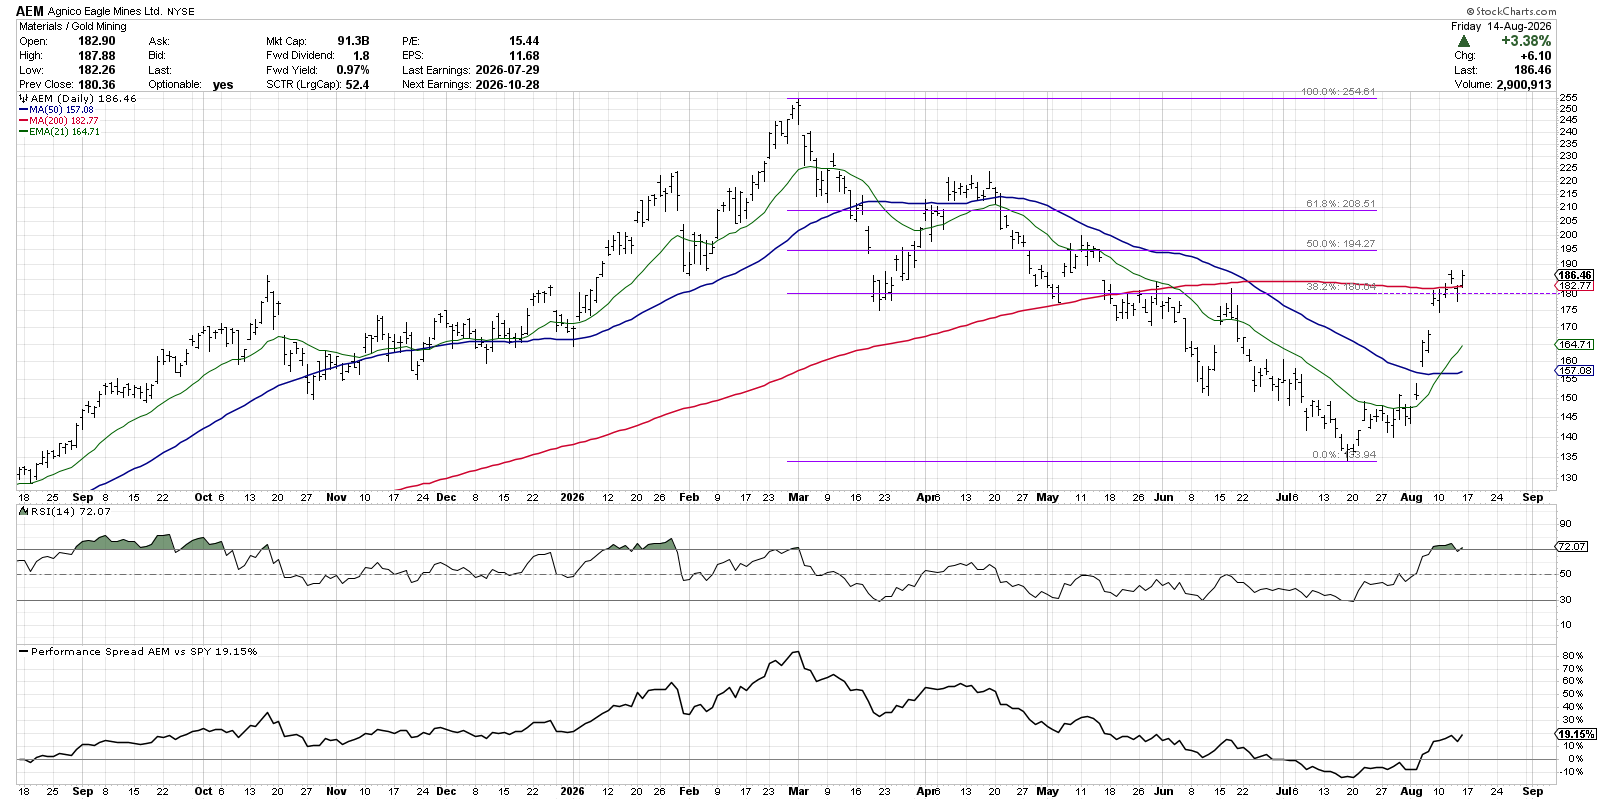
Here, we can see that the break above trendline resistance, followed by a move higher above the 200-day moving average, propelled AEM above the 38.2% Fibonacci level. If the price can remain above this “pivot point”, which lines up with swing highs and May and June, we’re inclined to assume further upside in this leading gold miner. However, if AEM is unable to hold $180 in the days and weeks to come, we’d start using the StockCharts Screener to identify better opportunities!
RR#6,
Dave
P.S. Ready to upgrade your investment process? Check out my free behavioral investing course!
David Keller, CMT
President and Chief Strategist
Sierra Alpha Research LLC
marketmisbehavior.com
https://www.youtube.com/c/MarketMisbehavior
Disclaimer: This blog is for educational purposes only and should not be construed as financial advice. The ideas and strategies should never be used without first assessing your own personal and financial situation, or without consulting a financial professional.
The author does not have a position in mentioned securities at the time of publication. Any opinions expressed herein are solely those of the author and do not in any way represent the views or opinions of any other person or entity.