Blue Tsunami Hits Wall Street, But Bulls Fight Back: Where Markets Go from Here

Key Takeaways
- Stocks rebounded sharply after initial midterm-election jitters, with the S&P 500, Treasury yields, and the dollar offering key technical signals.
- The SPX faces double-top resistance near 7800–7850, while Treasury yields and the U.S. dollar approach key support levels.
- Gold surged 3% after the election, while broader cross-asset trends suggest the market's primary direction remains largely unchanged.
Stocks searched for a clearing event. They may have gotten one via the midterm elections.
A blue tsunami initially triggered red across the board in futures markets at home and AI-linked indexes globally, but the bulls stormed back by the time results were digested. While knee-jerk and snap-back responses are common following major geopolitical events (including elections), traders appear to be breathing a sigh of relief now that there's some certainty about the Congressional balance of power heading into 2027.
S&P 500 futures fell 1% by late Tuesday night but then stormed higher before the opening bell. Treasury yields fell, oil was slightly in the red, and the dollar weakened. Investors' primary concern is how the AI trade and data center buildout will be affected by Tuesday's results. That's up for macro debate, though sharp losses appeared across Industrials and Utilities niches, likely reflecting the potential new regulatory backdrop. Elon Musk took the biggest hit, with SpaceX (SPCX) and Tesla (TSLA) among the largest losers, too.
What do the charts say? Let's get a first read on the post-election technical playbook.
Stocks: Bulls Have Post-Election Wood to Chop
Starting with the S&P 500 ($SPX), U.S. large caps had been flat since late May as voters headed to the polls. The index masked significant (but not severe) volatility under the surface and intense thematic rotation.
Recall that mega-caps jumped off the July 29 Situational Awareness low, then continued catching bids as Treasury yields lifted following Fed Chair Warsh's speech from Jackson Hole (SPX 7508 is a key spot). October was a sectoral reversal, however, with Health Care, Consumer Staples, and Utilities screaming upward as many tech-related and AI plays were on heavy offer.
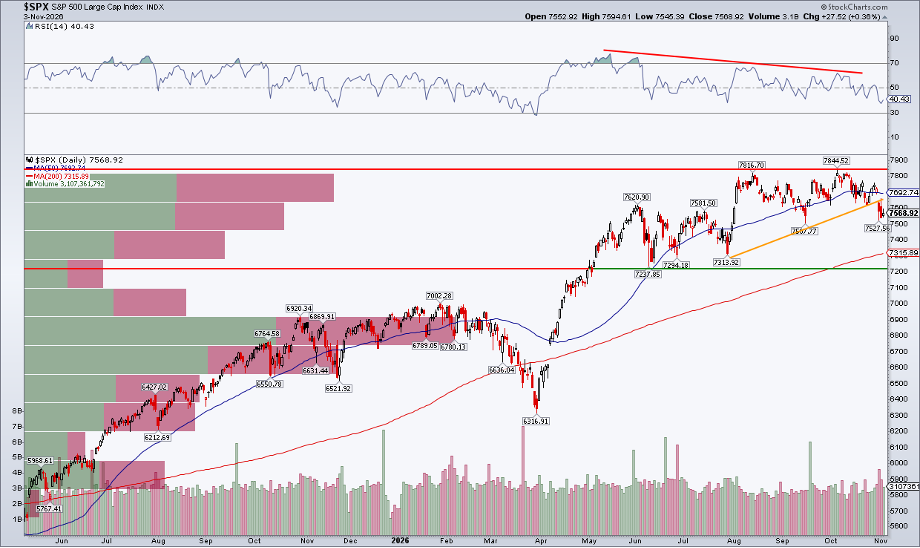
Today, the SPX chart is no beauty. Double-top resistance is seen between 7800 and 7850, while the long-term 200-day moving average could still be visited if the bears reassert themselves. A small trendline break last week is somewhat ominous, while RSI momentum is tepid at best.
The good news for the bulls? This indecisive and sloppy price action is common leading into elections, and a seasonal run-up through year-end would fit many historical analogues.
Bonds: The 10-Year Nears Critical Yield Support
The benchmark 10-year Treasury rate ($TNX) is also in focus. The intermarket storyline would seem to be that stricter data center policy leads to less AI buildout, hence more restrained capital demands and perhaps lower interest rates. Rarely does the market precisely play along with a well-packaged narrative, but, for now, yields are easing.
For the 10-year, the 38.2% Fibonacci retracement of the February 27 low at 3.956% to the October 7 high at 5.634% hits at 4.869%.
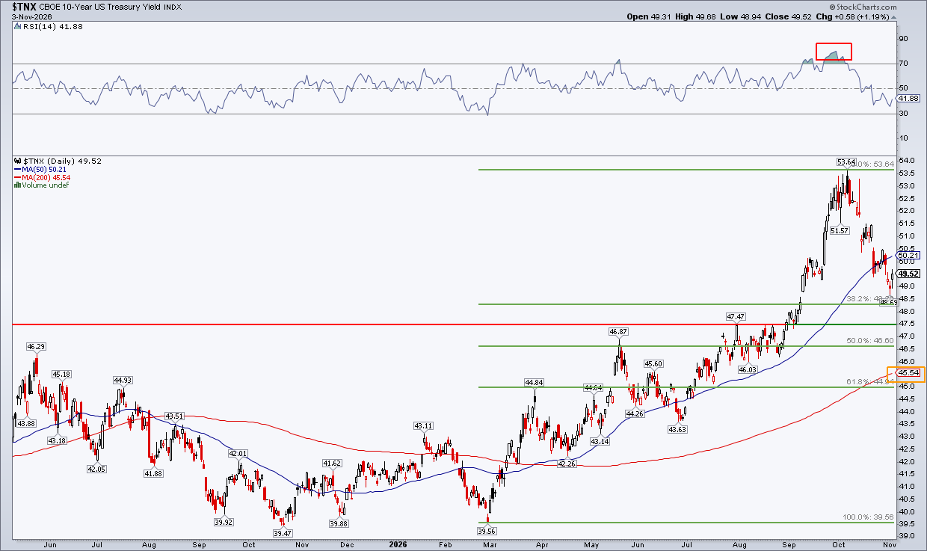
Bond traders tested that mark before the midterms, and they have their eyes on it once more. Below that, 4.75% was horizontal resistance on the way up, so polarity asserts that it should be support on the way down. With a still-rising 200-DMA, bond bears still control the trend.
Also look at the RSI momentum oscillator at the top of the SharpChart; it tagged its highest level in four years at the October high, and the decline to 40 today leaves the RSI at the base of the supposed bullish 40-to-90 range.
Dollar: An Intermarket Tug-of-War
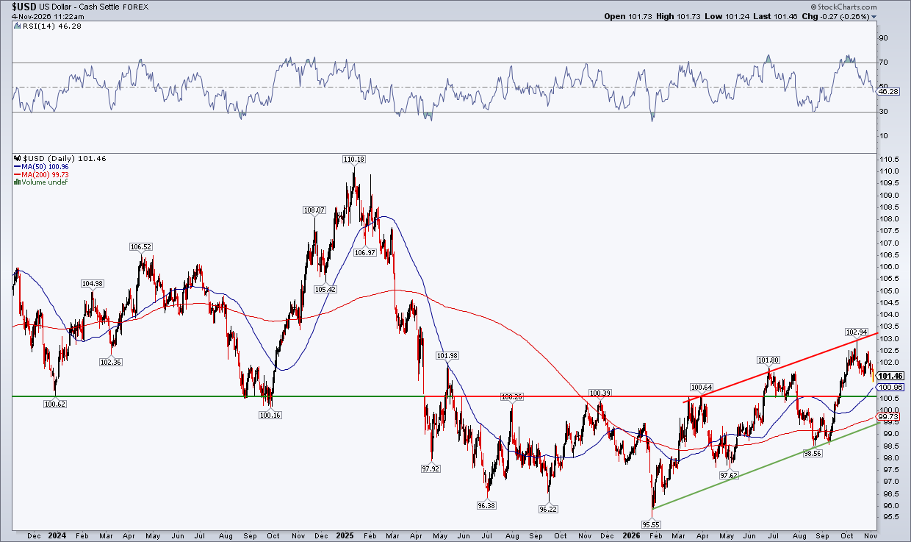
With stocks rangebound, set up well seasonally speaking, and yields having pulled back but not broken down, what's the dollar doing? Once again, there's an intermarket tether.
Lower yields lately have brought the buck into the middle of an apparent uptrend channel. As it stands, there's a positive relationship between tech & AI relative strength and the greenback. Whether there's truly less need for debt financing post-midterms remains to be seen, but a further U.S. Dollar Index ($USD) dip to, say, 100 would keep the multi-quarter gradual uptrend intact. I'm still watching the 100.6 level, as that has been a battleground between the bulls and bears.
Eyes on Gold
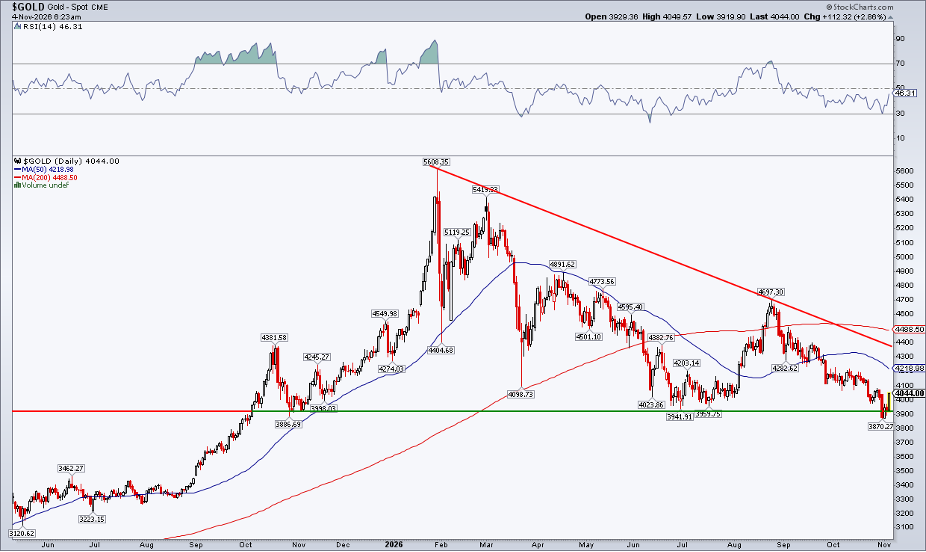
One chart to watch is gold ($GOLD). The yellow metal was among the biggest post-election gainers, spiking 3% by Wednesday morning. There's potential for a false breakdown here. The decline to $3970 also marked a 52-week low, surely stinging the psyche of the gold bugs.
Don't Confuse Ripples With the Tide
Putting it all together, not a whole lot has changed when scanning cross-asset trends in the blue wave's immediate wake. It's a reminder that markets move in three oceanic phases, as Charles Dow outlined so many generations ago. The tide is the primary trend, enduring many years; the waves are secondary trends, the reactions and corrections that can last weeks or months; the ripples are the day-to-day noise. Rarely does a single event upend the financial sea.
The Bottom Line
The bulls may have gotten that clearing event they so badly desired. It was shades of Election Night 2016 (albeit with far less dramatic swings), with risk assets initially diving as traders sussed out signal from noise Tuesday night. But bulls swooped in, buying stocks across the board. Yields edged lower, gold surged, and oil gave back modest ground. Historically, patterns augur for more risk-on appetite through the end of the year and potentially the middle of 2027.
Disclaimer: This blog is for educational purposes only and should not be construed as financial advice. The ideas and strategies should never be used without first assessing your own personal and financial situation, or without consulting a financial professional.