Nasdaq Breaks Out as Tech Stocks Rally. Can the Momentum Continue?

Key Takeaways
- Tech stocks led a broad market rally, with the Nasdaq breaking above its downtrend and the S&P 500 and Dow reaching new highs.
- Falling oil prices are easing inflation concerns, but Middle East developments are a key risk.
- Momentum is improving, but volatility is quietly moving higher. Investors should watch key support levels and intermarket signals.
August is off to a strong start, with risk-on sentiment firmly in control. Solid earnings, especially from technology companies, sent stocks sharply higher, alongside the prospect of a peace agreement between the U.S. and Iran.
It wasn’t just a technology rally, though; small-caps, mid-caps, transportation stocks all participated. Most of the S&P 500 sectors finished in positive territory, while the few sectors that declined were only marginally lower. The Dow Jones Industrial Average ($INDU) and S&P 500 ($SPX) closed at record highs. Meanwhile, the Nasdaq Composite ($COMPQ) broke above its short-term downtrend and gained 2.59%.
Palantir Technologies (PLTR) was one of the biggest catalysts. It reported strong earnings and revenue after Monday’s close, sending the stock soaring 29.54%.
Another notable earnings report this week came from SpaceX (SPCX), its first one since becoming a publicly traded company. The stock moved lower in after-hours trading, as did Advanced Micro Devices (AMD), which also reported after the close.
Could the decline in these two stocks change the market’s tone on Wednesday? Probably not. If anything were to shift the tone, it would be news that a U.S.-Iran peace agreement is no longer likely.
Technology Back In the Driver’s Seat
Technology was Tuesday’s strongest performing sector. A quick look at the chart of the Technology Select Sector SPDR ETF (XLK) gives you a good idea of how much the technical picture improved in one day.
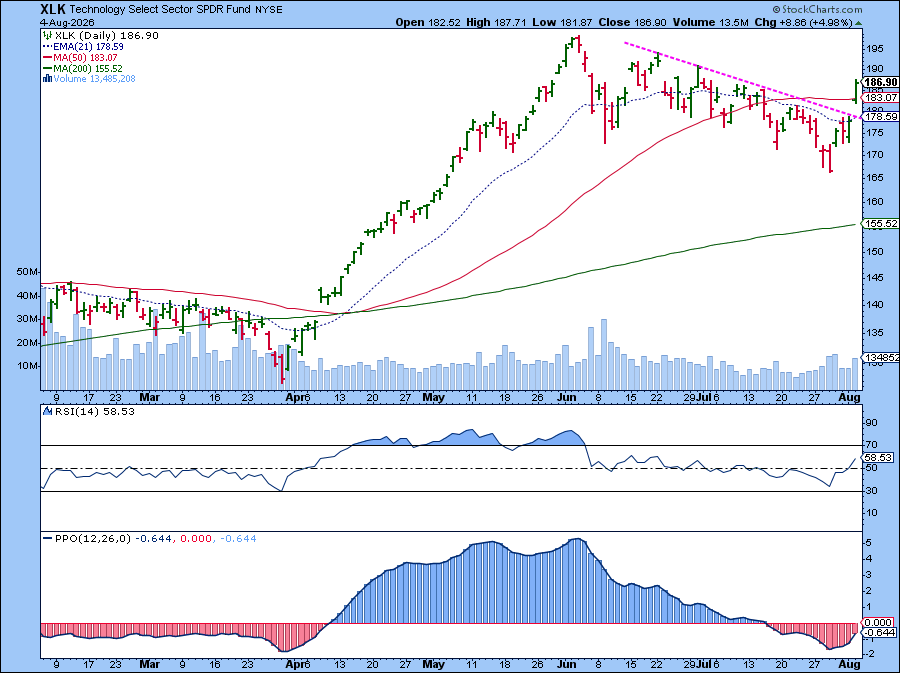
XLK gapped higher, breaking above its downward-sloping trendline and 50-day simple moving average (SMA). Momentum is also strengthening, as reflected by the Relative Strength Index (RSI) and Percentage Price Oscillator (PPO) in the lower panels.
If XLK can establish a sustained uptrend, with RSI crossing above 70 and PPO entering positive territory, technology stocks could be positioned for another leg higher.
Nasdaq Breaks Out
The Nasdaq presents a similar setup. I’ve marked several potential support and resistance levels on the chart below.
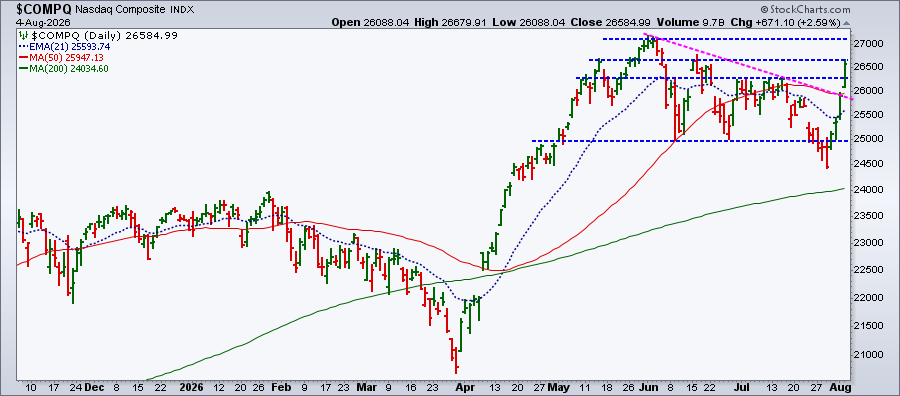
Tuesday’s 2.59% move higher saw the index break past the 26,250 level. It then tested the 26,700 area before pulling back slightly into the close. The index also broke above its downward-sloping trendline, adding support to the bullish case.
Those same levels would apply if things got bearish. A pullback toward one of the support levels or the trendline could present a dip-buying opportunity, as long as buyers step in and there’s followthrough.
Falling Oil Prices Add Support
While stocks rallied, crude oil prices moved lower. Both West Texas Intermediate Light Crude ($WTIC) and Brent Crude ($BRENT) are trading below $80 per barrel. Both are trading below their 200-day SMA. The chart below shows $WTIC closed just below its 200-day SMA and is testing it after hours.
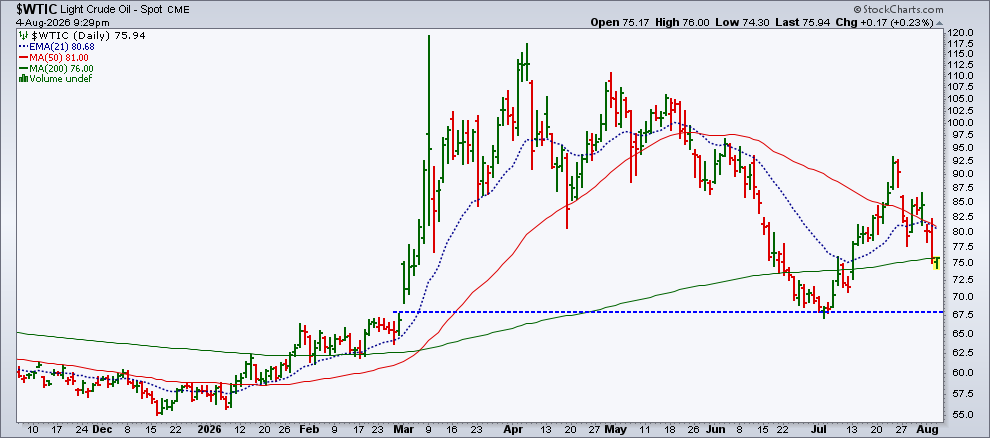
If conditions in the Middle East stabilize, WTIC could fall to around $67.50. But if tensions escalate, crude could quickly reverse higher, reclaiming its 200-day SMA and 21-day exponential moving average (EMA).
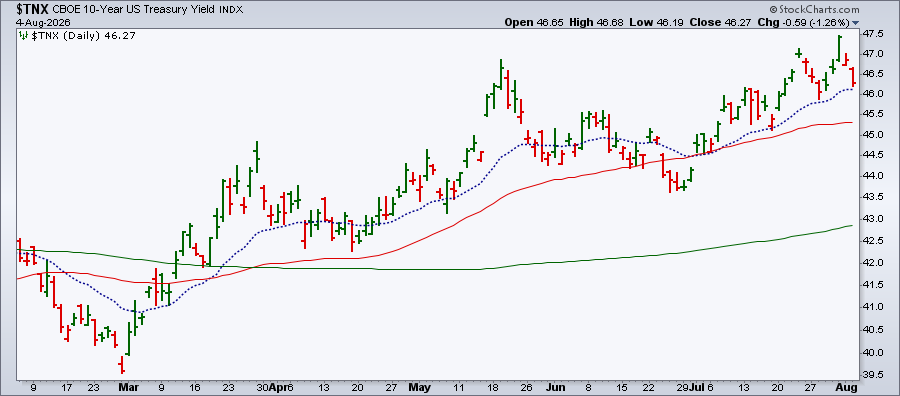
Lower oil prices would ease inflation fears and reduce the likelihood of interest rate hikes this year. The 10-Year US Treasury Yield Index ($TNX) has pulled back after hitting a high of 4.74% on July 31, 2025. The trend is still up, though, with the 21-day EMA serving as the first support level to watch.
Both Eyes on Volatility
The rest of the week could still bring plenty of volatility. The Cboe Volatility Index ($VIX) rose 4.04% on Tuesday, even with the record highs and the tech stock euphoria.
When equities show heightened optimism, I like to check other asset groups such as oil, bonds, and volatility to see if they’re flashing any warning signs. At the moment, I’m not seeing anything that would spoil the bull party. Still, though, conditions can change quickly. Make a habit of checking the StockCharts Dashboard and Market Summary page regularly so you can stay on top of shifts in market leadership, momentum, and risk sentiment.
StockCharts members get the clearest view of the market. Visit the Market Summary page to see the day's action across indexes, sectors, and asset classes—all in one place.
Disclaimer: This blog is for educational purposes only and should not be construed as financial advice. The ideas and strategies should never be used without first assessing your own personal and financial situation, or without consulting a financial professional.