Four Big Questions Facing the Stock Market in the Second Half

Key Takeaways
- New trends emerge across equities, bonds, and oil, and with intermarket leadership ahead of a notorious Presidential Election Cycle stretch.
- Midterm-year volatility, Treasury yields, and energy prices could shape market direction.
- A Big Tech rebound and consumer strength remain critical for continued S&P 500 gains.
It's jobs week on Wall Street. Payrolls Thursday comes ahead of the long holiday weekend, and economists expect another solid report. There’s a decent chance of a fourth straight 100k-plus print, while the unemployment rate is forecast to hold steady near 4.3%. Key ISM Manufacturing PMI survey data hits Wednesday morning, shortly after Fed Chair Kevin Warsh’s hotly anticipated speaking engagement alongside ECB President Christine Lagarde.
As for price action, the S&P 500 ($SPX) is on its front foot to start the week. Earlier in the month, U.S. large caps took the June FOMC interest rate decision and hawkish pivot in stride with just minor declines. A direct Warsh, who seemed to almost ignore the maximum employment piece of the Fed’s dual mandate, was actually a net boon to the bond market.
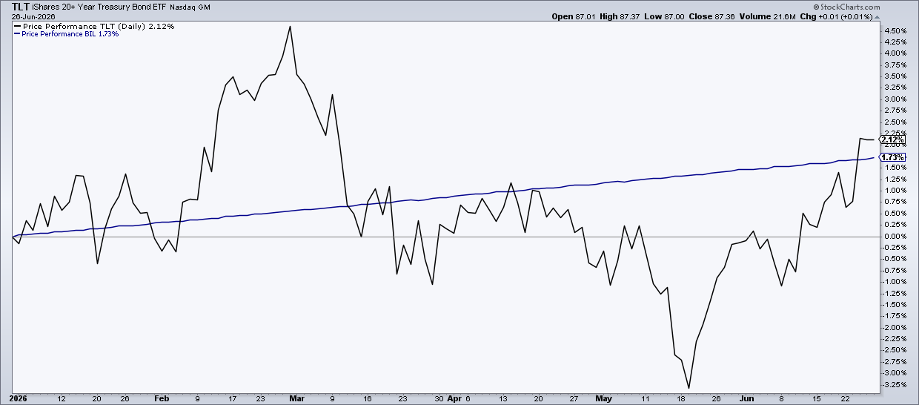
The 30-year Treasury yield now seems anchored under 5%. Recall that, coming into 2026, the consensus expected a steepening yield curve. Funny enough, with the second quarter about to wrap up, the iShares 20+ Year Treasury Bond ETF (TLT) has been outperforming the SPDR Bloomberg 1-3 Month T-Bill ETF (BIL) YTD.
But what’s in store for the second half? That’s what traders want to know. Of course, price action is the arbiter, and here are a few questions to ponder as the calendar turns.
1. Will the S&P 500 endure midterm-year drama?
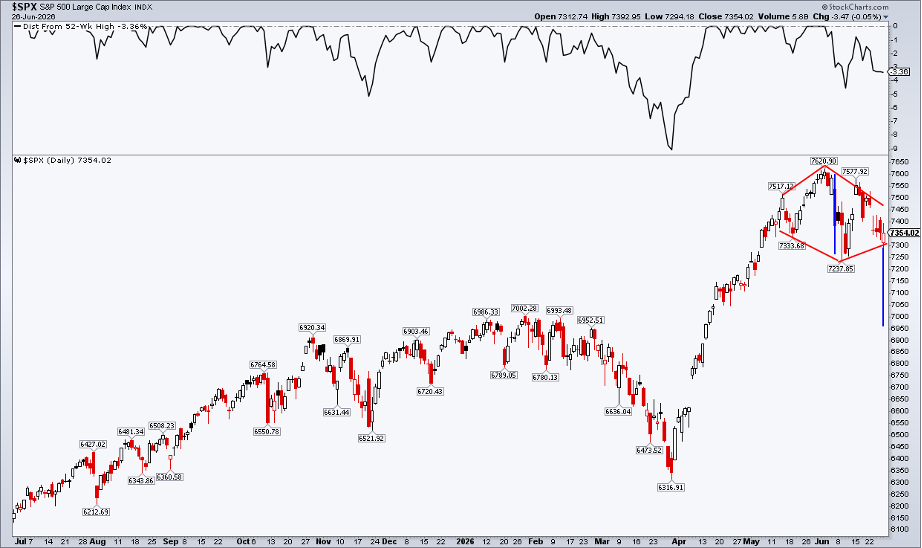
Remember all those cautionary predictions regarding how stocks tend to be more volatile at this point in the Presidential Election Cycle? The average drawdown leading into the midterms is 18.5%, with a tepid typical stock market gain. So far, the SPX’s largest YTD decline is 9%. Using StockCharts’ new Distance From Highs tool, you can gauge a dip’s magnitude by layering in that indicator.
Q3 of the midterm year has been notoriously riddled with volatility and shakeouts. Is it different this time? Are U.S. large caps battle-tested, having endured the 2025 trade war and this year’s hot war with Iran?
If we are to see a near bear market, it might begin with a concerning technical pattern on the SPX. Notice in the chart below that an emerging diamond-top formation could get the fireworks going for the bears. Not as widely known as, say, a head-and-shoulders pattern, the measured-move downside price objective here would likely be roughly 6950 (depending on where the actual breakdown occurs). That mark has confluence with the January–February highs.
2. Will the 30-year yield test 5.15%–5.20% again? Will it break out?
The long bond has surprised investors recently. A multi-year (even multi-decade) breakout appeared to be underway during the middle of Q2, given a seemingly relaxed Fed, bullish commodity price action, and AI-fueled economic growth. Unstable fiscal matters in the UK and Japan made the bond selloff a global story, too.
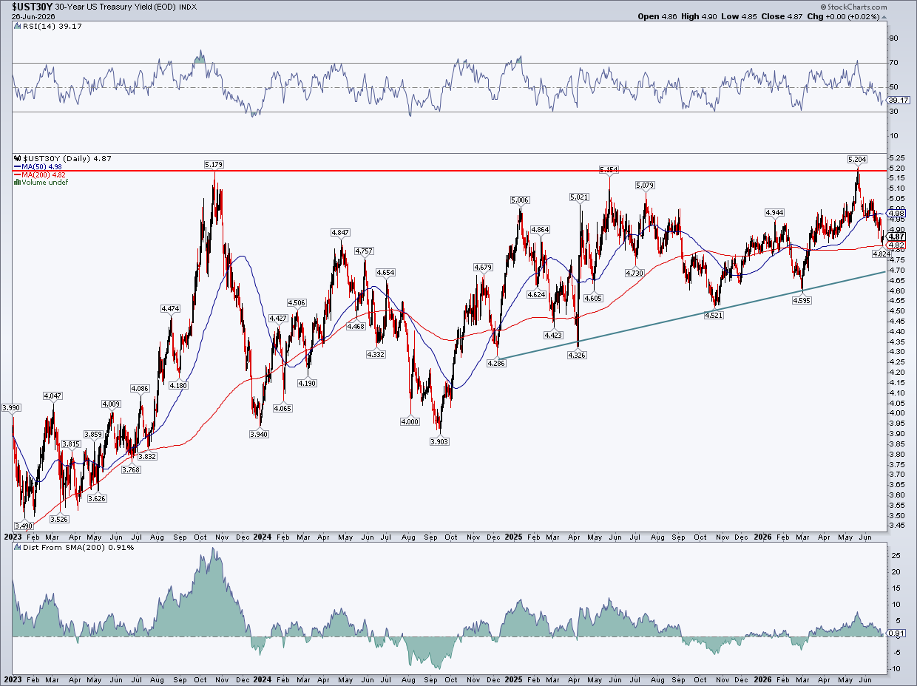
But the 30-year Treasury rate is back at its long-term 200-day moving average. In fact, using another new StockCharts indicator, $UST30Y is within a percentage point of its 200-day moving average. Flat in its slope, there’s now a battle between the bond bulls and bears.
Bigger picture, an uptrend support line comes into play near 4.70%, while 5.15% to 5.20% is resistance. A measured-move upside target of 6.35% is triggered upon a thrust above that range.
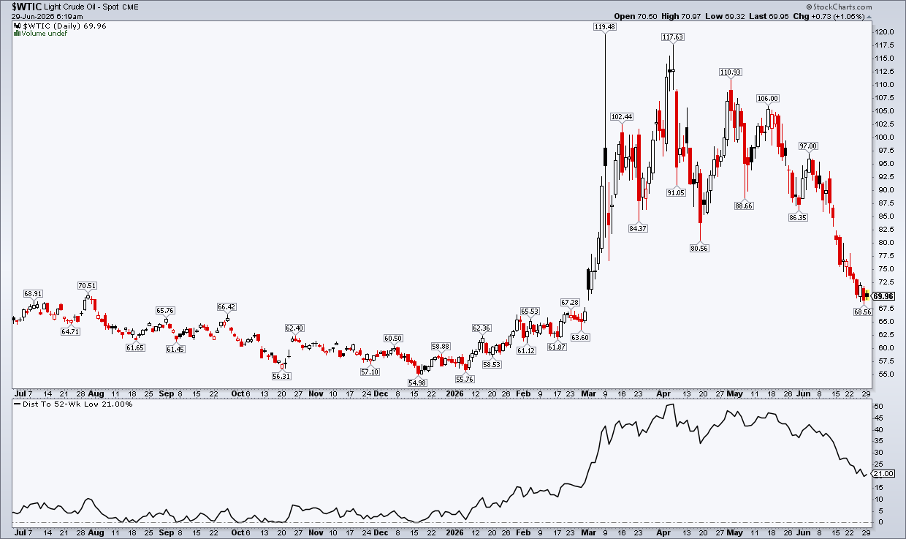
3. Is oil done? What will lower energy prices mean for cyclical stocks?
WTI and Brent crude oil peaked near $120 in March and April. Despite apparent ceasefire violations and continued saber-rattling from both sides in the U.S.-Iran conflict, the bears have sunk their teeth into the oil market.
Still, oil is more than 21% above its December 52-week low. Gasoline futures, meanwhile, trade at a historic premium to WTI. Consumers are still waiting for prices at the pump to venture closer to $3 per gallon than $4.
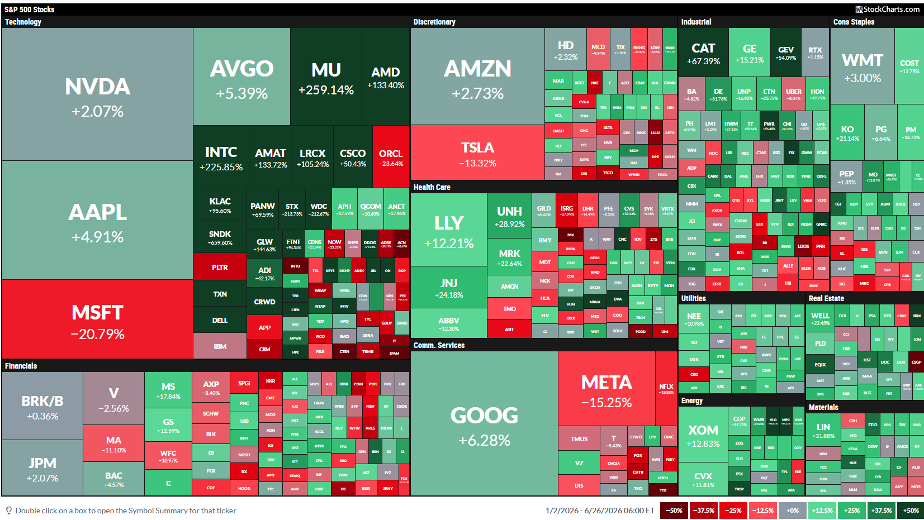
Since June 3, however, the growth style has taken a back seat to cheap defensives and cyclical value. Health Care leads, with Eli Lilly (LLY) and Johnson & Johnson (JNJ) looking magnificent, while Utilities, Real Estate, Financials, Industrials, and Consumer Staples have left the cap-weighted S&P 500 in the dust. The equal-weight sector versions confirm the style alpha shift, too.
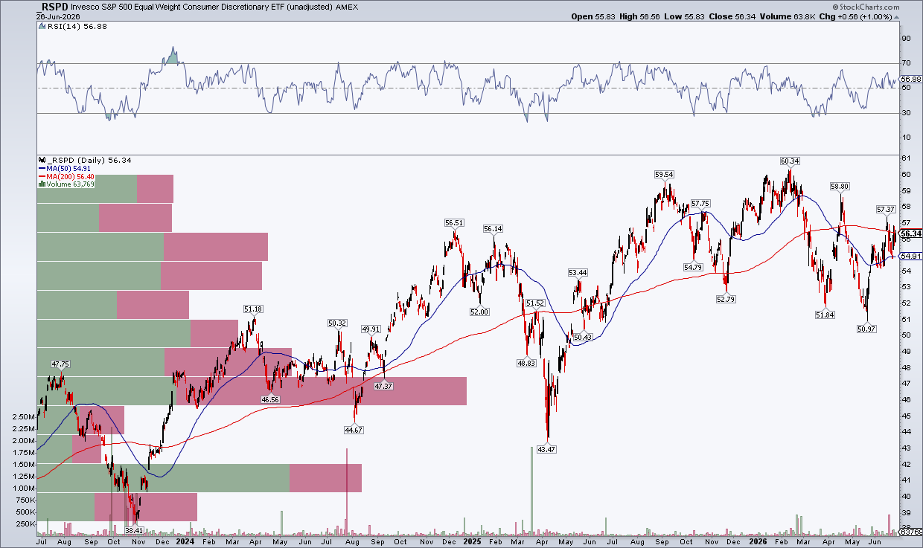
I’ll be watching the Invesco S&P 500 Equal Weight Consumer Discretionary ETF (RSPD) over the back half of 2026. It’s already about 10% above its late-May low; a jump through the pre-war peak of $60.34 would be welcome news amid still near-record-low consumer sentiment. At the intermarket level, the US Dollar Index ($USD) is still in breakout mode.
4. Can the Mag 7 get their mojo back?
I detailed the Mag 7’s travails last week, but it will simply be mathematically challenging for the S&P 500 to print higher highs and higher lows, with some of its largest positions staying stuck in the mud.
YTD, NVIDIA (NVDA), Apple (AAPL), Alphabet (GOOGL), and Amazon (AMZN) are merely marginally higher. Microsoft (MSFT), Meta Platforms (META), and Tesla (TSLA) are down big.
Traders should expect continued volatility as these choppy price-action stories persist. The key indicator might be the Nasdaq 100 Volatility Index ($VXN)... above 30, and Mag 7 bears may hang around.
The Bottom Line
There’s no shortage of market storylines heading into the second half. Technicals and price trends should guide us, though. For now, the most bullish short-term seasonal stretch is at hand, with positive trends often unfolding through mid-July. Be sure to monitor the aforementioned trends and unknowns as Q3 gets going.
Disclaimer: This blog is for educational purposes only and should not be construed as financial advice. The ideas and strategies should never be used without first assessing your own personal and financial situation, or without consulting a financial professional.