The Summer Market Setup Is Here. Oil, Bonds, and the Dollar Hold the Key

Key Takeaways
- Intermarket analysis reveals important clues about mid-year trends, with stocks near record highs and commodities ebbing.
- Long-dated bond yields remain stubborn, and traders must go global with fixed-income trend analysis.
- Cross-asset correlations are some of the lowest in recent memory, but that can quickly change.
One hundred trading days into the year, traders have waded through choppy waters. Geopolitical upheavals, gangbuster earnings seasons, and mini booms and busts have shaped 2026 so far. In all, the S&P 500 ETF (SPY) has returned 10.4%, with two trading days to go before June.
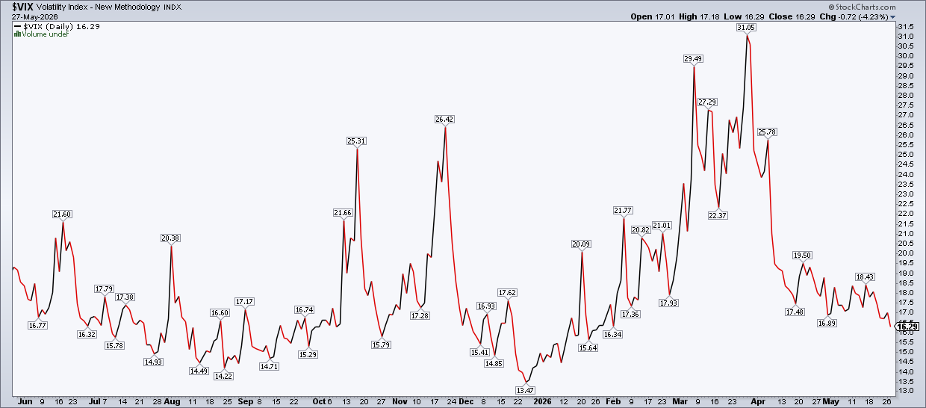
On Wednesday, SPY ranged just 0.4% (its smallest intraday swing in five months), while the Cboe Volatility Index (VIX) settled at its lowest level since January 26. The five-month low in Wall Street’s fear gauge came alongside easing interest-rate volatility, too, as measured by the ICE MOVE Index (MOVE). Down six sessions running as Powell exited and Warsh entered, softer stock & bond volatility is perhaps a welcome trend on the macro and intermarket front.
Quiet Markets, Loud Signals
As cross-asset conditions calm (for now), and ahead of a big week of jobs data, now is an opportunity to revisit the big picture for clues on summer moves. Analyzing what’s happening at the index level is particularly useful amid intense momentum in story stocks and industry themes. Indeed, we are living through history with semiconductors, while space equities are on their own moonshot.
Up-and-down consumer categories, stubborn long-dated yields, sagging crypto and precious metals, and the oil complex prove that intra-market correlations are low, which is usually a trader’s dream. But might that change? Correlations can quickly revert to one, so checking in on broad action is crucial.
The SharpChart That Explains Everything
Let’s begin with one of my favorite SharpCharts: the Market Summary’s Intermarket Analysis view. When I speak to finance students at the University of North Florida, this is what I recommend studying to best understand what’s happening in markets.
What jumps off the page? Oil.
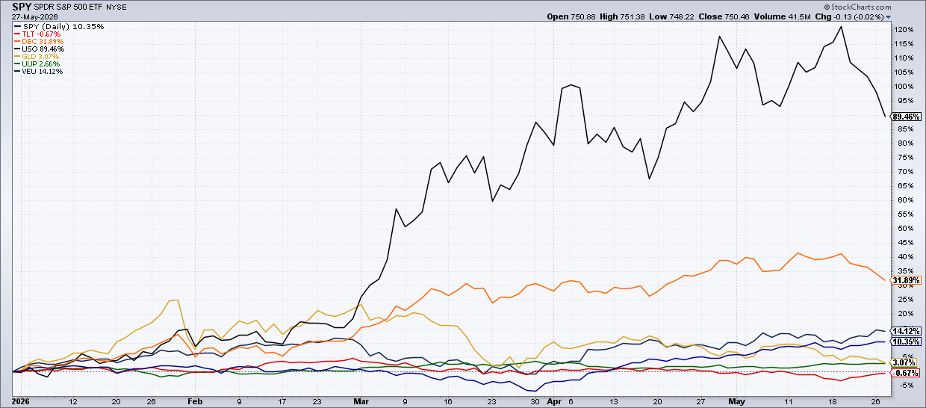
The United States Oil Fund (USO) was up by more than 120% YTD during the penultimate week of May, but it has since retreated to just a 90% gain in 2026. WTI crude oil fell for five straight days through midweek, helping send Treasury yields lower, consumer stocks higher, and ushering in a broader, more risk-on rally. Look no further than the iShares Russell 2000 ETF (IWM) and iShares MSCI Emerging Markets ETF (EEM), which have absolutely ripped over the past week.
Commodities Lose Momentum
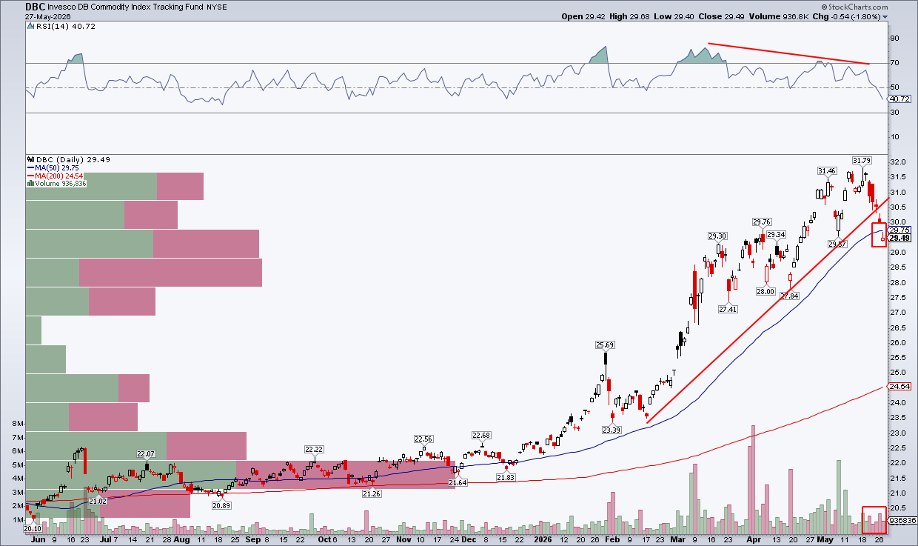
Dropping down on the y-axis, we find the Invesco DB Commodity Index Tracking Fund (DBC) in orange. The commodity ETF has been in jail lately, also falling day after day, marking its worst five-session slide since immediately after “Liberation Day” more than 13 months ago. DBC dipped below its flattening 50-day moving average for the first time since December, and you have to go back to August 2025 to find a lower 14-period RSI momentum oscillator reading.
The drop comes after a clear bearish price-momentum divergence as well. So, it’s not just oil that’s slipping, but the entire commodity complex.
The March 30 Inflection, and Why It Matters Going Forward
From there, we venture lower on the performance chart to SPY. Recall that it was just two months ago when we were talking about one of the worst starts to a year on record. Bold sellside year-end targets appeared to be in jeopardy as Q1’s finish approached. But the March 30 V-bottom low turned out to be more of a checkmark shape, and domestic large caps are now almost 20% off the bottom... and strategists are now hiking their SPX price forecasts.
Surely helped by gains in the likes of Taiwan Semiconductor (TSM), Samsung, and SK Hynix, VEU is still a very diversified fund, with a low percentage of assets in its top 10 holdings.
Gold’s Shine Fades
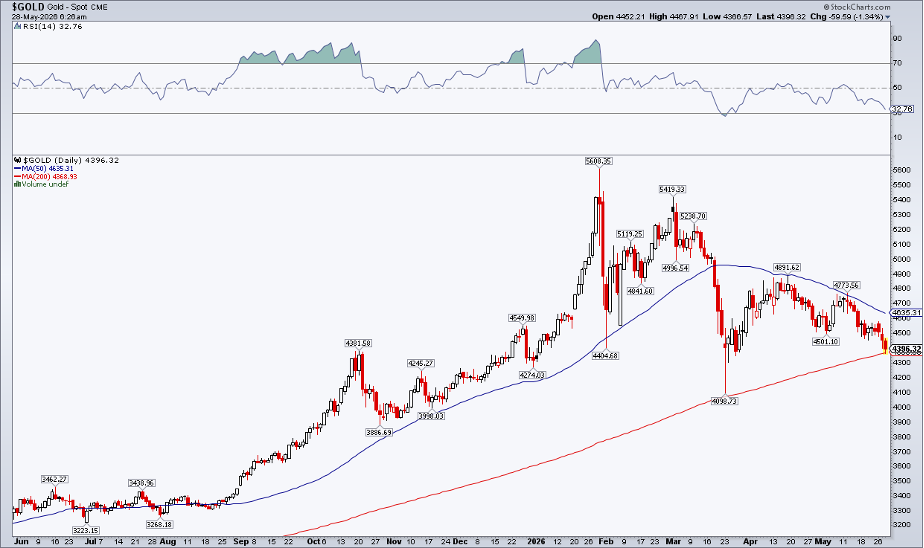
The SPDR Gold Trust (GLD) is next on the performance pecking order, up just 3.1% so far in 2026. With a down move on Thursday, the yellow metal threatens to turn negative on the year after a stunning January rally that reached 20% at its zenith.
Blame the pullback on intermarket trends. Rising real yields do precious metals few favors. What’s more, momentum can be fleeting and shifty; all the glitz and glamour have been on chip stocks since March.
Don’t Ignore the Currency Market
I mentioned the dollar before. The past 12 months continue to rank among the quietest (most boring!) periods in the greenback’s history. The Invesco DB U.S. Dollar Index Bullish Fund (UUP) generally tracks the U.S. Dollar Index ($USD) and, while UUP has been trending higher, there is no clear trend in the $USD itself.
But is the currency market too snoozy? I think the dollar, euro, yen, and pound should be on watch for big moves this summer, just as most macro onlookers look past FX.
Bonds Still Hold the Power Around the Globe
Finally, there’s one major tradable asset in the red this year. The iShares 20+ Year Treasury Bond ETF (TLT) has rebounded recently, but 20-t0-30-year Treasury yields remain perched near 5%.
For investors and traders alike, monitoring intercontinental trends is key. Long bonds in Europe and Asia-Pac are in charge for now, while fiscal matters in the U.S. are also said to be putting upward pressure on rates.
Technicians don’t care about the reasons. The price trend is down, and selling TLT rallies would appear to be the summer playbook.
The Bottom Line
Volatility has waned, and global markets are at or near record highs. Chip stocks lead, but equity participation has been pretty solid. The S&P 500 Equal Weight ETF (RSP), along with IWM and VEU, could very well tag record weekly levels heading into June. I’ll be watching how commodities trade next month, as bears stand their ground in the oil market.
Ready to see the market through a wider lens? Head to the Market Summary page and dive into the Intermarket Analysis panel for a real-time read on stocks, bonds, commodities, oil, gold, and the dollar — all in one place.
Disclaimer: This blog is for educational purposes only and should not be construed as financial advice. The ideas and strategies should never be used without first assessing your own personal and financial situation, or without consulting a financial professional.