Stocks Break Out to New Highs — Is 8,000 Next for the S&P 500?

Key Takeaways
- Cooler inflation data and easing inflation expectations give investors more reason to expect no rate hike at the September FOMC meeting.
- The S&P 500 notched a record close, breadth remains bullish, and strength is extending beyond mega-cap tech stocks.
- Volatility is low, yields are easing, and investors remain optimistic.
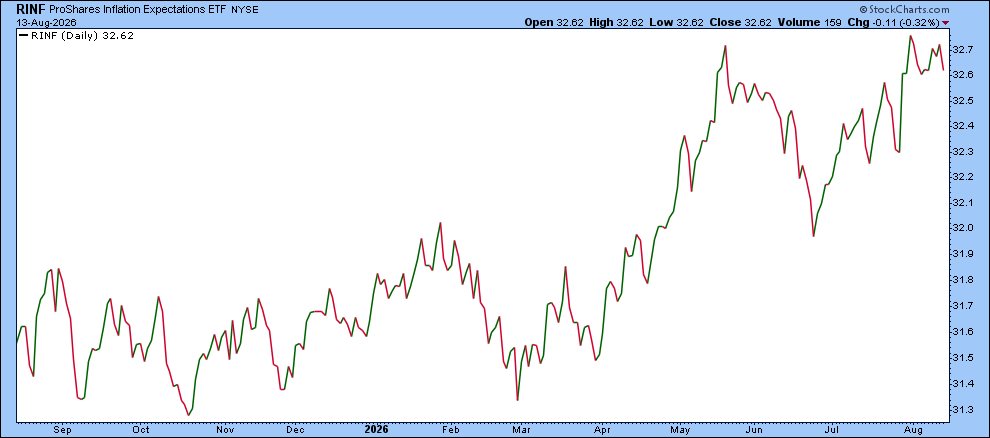
This week’s inflation data gave investors more reason to believe the Fed will leave interest rates unchanged at its September meeting. For now, the odds favor a pause rather than another rate hike.
The ProShares Inflation Expectations ETF (RINF) is trending slightly lower, supporting the view that inflation expectations remain subdued.
Stocks Finish Strong
Stocks moved higher, with the S&P 500 ($SPX) and S&P 400 Mid Cap Index ($MID) closing at fresh highs. The S&P 500 finally broke out of the trading range that had contained it for the past six trading days. With the index now above 7,780, the next potential target could be 8,000.
Market breadth continues to favor the bulls. Advancing issues outnumbered decliners, and more than 50% of index components are trading above their 20-day simple moving averages.
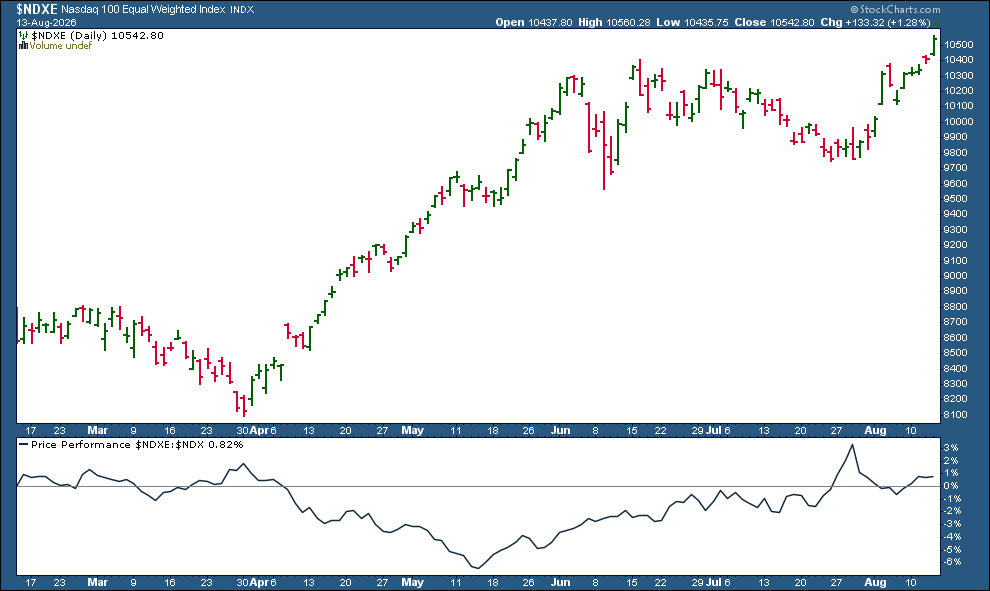
Equal-weighted indexes also participated in the advance. The S&P 500 Equal Weighted Index ($SPXEW) and Nasdaq 100 Equal Weighted Index ($NDXE) closed at record highs. In the chart below, you can see that NDXE outperformed the Nasdaq 100 Index ($NDX) by 0.82%.
Mega-cap tech stocks helped lead the market higher, but the strength wasn’t limited to technology. Several other areas of the market posted solid gains as well. Thursday’s top three sector performers were Communication Services, Real Estate, and Consumer Staples. Meta Platforms (META) and Netflix (NFLX) helped lift Communication Services, while Real Estate benefited from the cooler-than-expected inflation data.
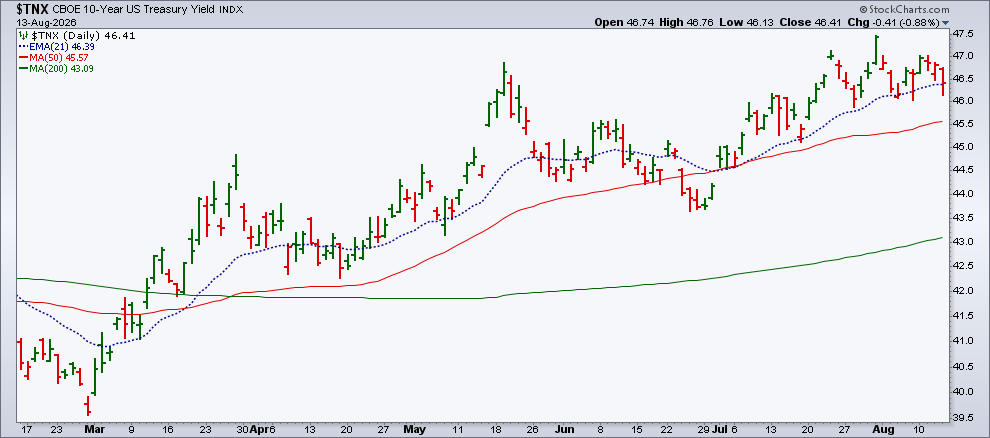
The 10-Year U.S. Treasury Yield Index ($TNX) fell 0.88% on Thursday. As the chart below shows, $TNX closed near its 21-day exponential moving average (EMA). Yields have been making lower highs, but we still need to see a series of lower lows before calling it a confirmed downtrend.
Several bellwether industry groups also participated in Thursday’s rally, including transportation, homebuilders, regional banks, and retail. Overall, it was a bullish day for equities, with volatility staying low and investor sentiment remaining optimistic.
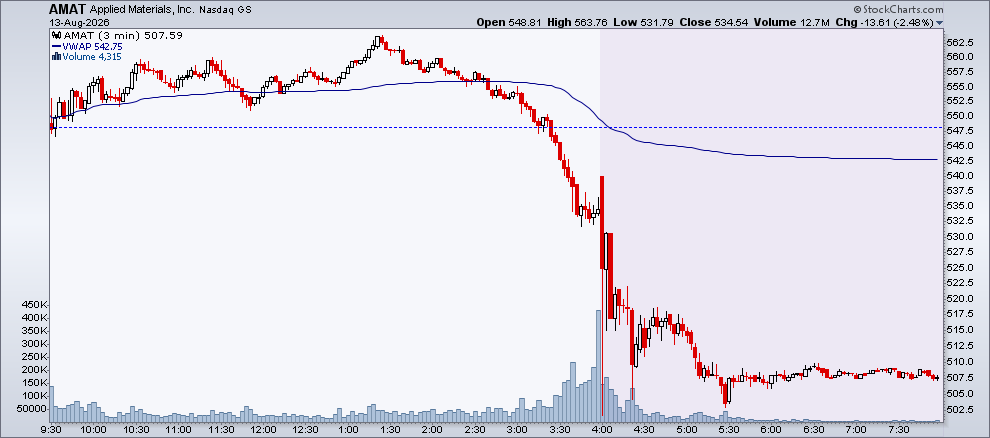
Applied Materials (AMAT) reported earnings after the close, beating expectations on earnings and revenues. The stock traded lower in after-hours trading, though.
The intraday chart of AMAT shows the after-hours price action. The overlay is the Volume Weighted Average Price (VWAP), which is similar to the moving average but incorporates price and volume using intraday data. This makes it especially useful for analyzing very short-term price action.
Crude Continues to Fall
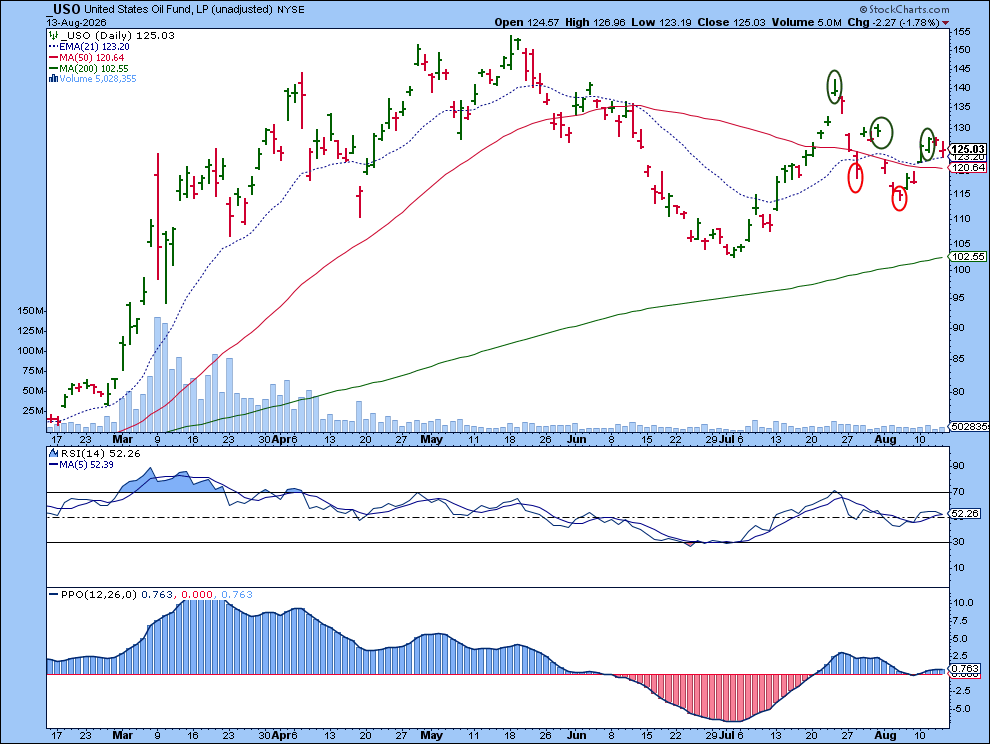
Crude oil prices continue to trend lower, driven largely by softer demand. Uncertainty surrounding the U.S.- Iran talks to reopen the Strait of Hormuz is another factor.
The chart of the United States Oil Fund (USO) shows a pattern of lower highs and lower lows, along with weakening momentum. Still, the decline doesn’t have much conviction yet, and that may remain the case until there’s more clarity around the Strait.
Precious Metals Lose Some Shine
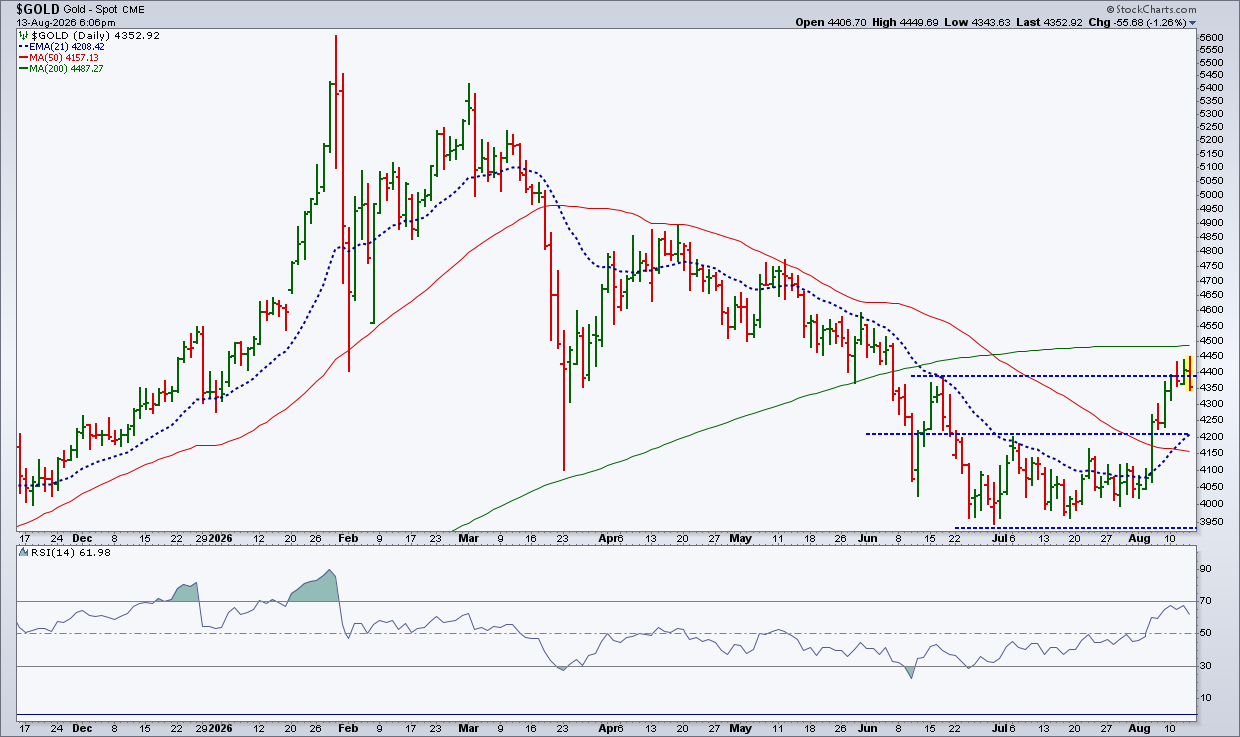
With inflation looking less threatening, demand for traditional inflation hedges has softened. That appears to have triggered some profit-taking in gold and silver, with gold pulling back from the $4,400 per ounce area.
The Bottom Line
As the second week of August winds down, the major indexes are in position for another strong finish. There isn’t much in this week’s market action that’s waving a red flag. Breadth is healthy, participation is expanding, volatility remains low, and the broader trend is still bullish.
A quick look at the Market Summary page can help you track the direction of the trend, whether market breadth is expanding or narrowing, and the overall tone of investor sentiment. Until signs of a crack start to surface, there’s little reason to fight the trend.
StockCharts members get the clearest view of the market. Visit the Market Summary page to see the day's action across indexes, sectors, and asset classes.
Disclaimer: This blog is for educational purposes only and should not be construed as financial advice. The ideas and strategies should never be used without first assessing your own personal and financial situation, or without consulting a financial professional.