Week Ahead: Nifty Snaps 8-Week Losing Streak; Sustaining Above This Point Crucial for Sustaining Rebound

The Indian equity markets attempted to stabilize after an extended period of weakness and ended the week on a positive note, snapping eight consecutive weeks of decline. The Nifty witnessed a technical rebound during the week, but the recovery remained tentative. The Index traded in a range of 596.20 points. Despite the positive weekly close, the Nifty failed to reclaim the crucial 200-week Moving Average, keeping the broader technical structure vulnerable. Volatility edged higher as India VIX rose by 5.67% to 15.28, reflecting continued uncertainty among market participants. The headline index eventually settled with a modest weekly gain of 98.50 points (+0.44%).
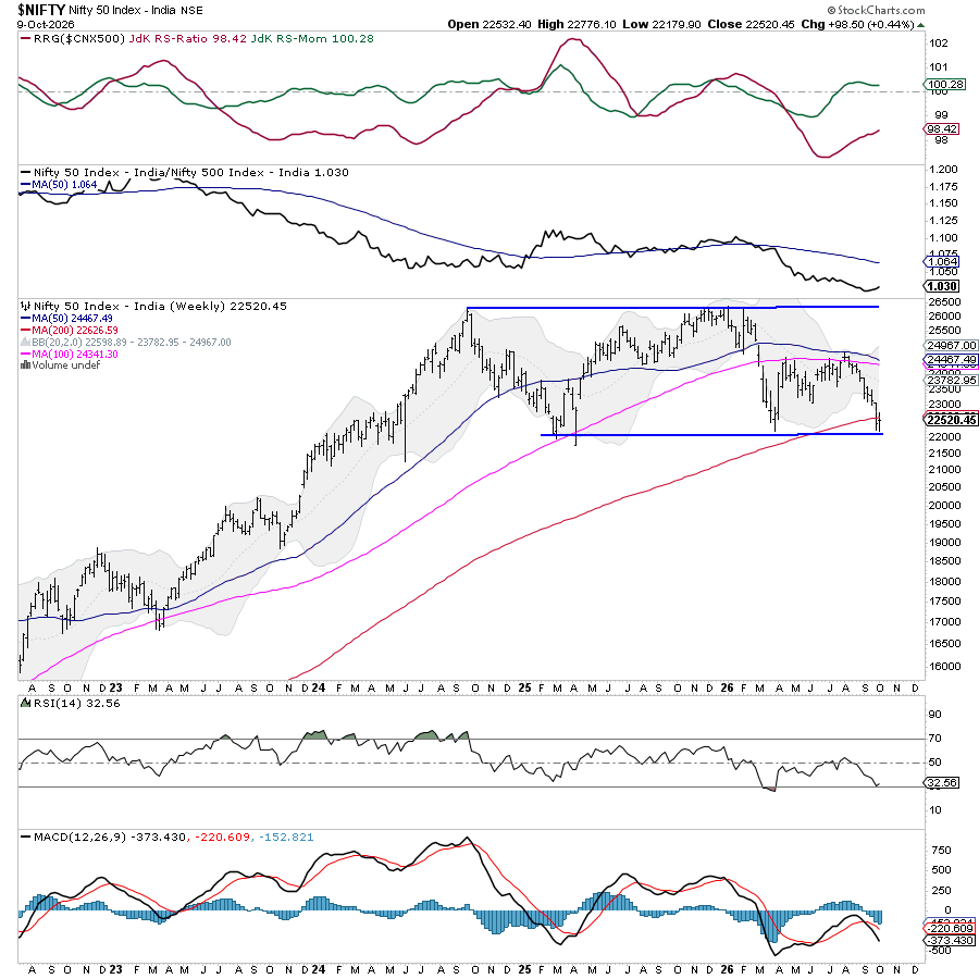
The markets are presently at a critical technical juncture. Although the Nifty has managed to interrupt its eight-week losing streak, the broader trend remains weak, with the Index trading below its important 200-week MA, currently placed at 22,627. The immediate technical setup, however, suggests a strong possibility of an extension of the ongoing rebound. This expectation is supported by positive divergences developing in the lead indicators on the daily charts. Nevertheless, the 200-week MA remains the decisive level to watch. A sustained move above 22,627, accompanied by a weekly close above this level, would be necessary for the recovery to gain credibility and extend towards higher resistance zones.
The coming week is likely to see a cautiously positive start. However, the Index may encounter resistance as it approaches its long-term moving average. The immediate resistance levels are placed at 22,630 and 22,780, while supports are expected at 22,300 and 22,100.
The weekly RSI stands at 32.56, in the lower end of the neutral range and reflecting persistent weakness in momentum, and it remains neutral against the price. The weekly MACD is still bearish, trading below its signal line, with the negative histogram indicating that downward momentum continues to dominate on the higher timeframe. The latest weekly candle has a “Spinning Top”, reflecting indecision and an attempt at stabilization near an important support area.
From a pattern analysis perspective, the Nifty remains under pressure after retreating from the upper boundary of a broad consolidation over two years. The Index is now testing the lower boundary, marked by a support trendline through key lows, which converges with the 200-week MA, making the 22,500–22,650 zone technically significant. The near-support level suggests room for a technical rebound.
Market participants should approach the coming week with guarded optimism. Positive divergences on daily charts suggest the possibility of further recovery, but the Nifty's failure to close above its 200-week MA and sustaining above that point will be a key requisite. Increased buying should wait until the market sustains above the long-term average. Until then, a cautious, stock-specific, and disciplined risk management approach is best.
Sector Analysis for the Coming Week
In our look at Relative Rotation Graphs®, we compared various sectors against the CNX500 (NIFTY 500 Index), representing over 95% of the free-float market cap of all the listed stocks.
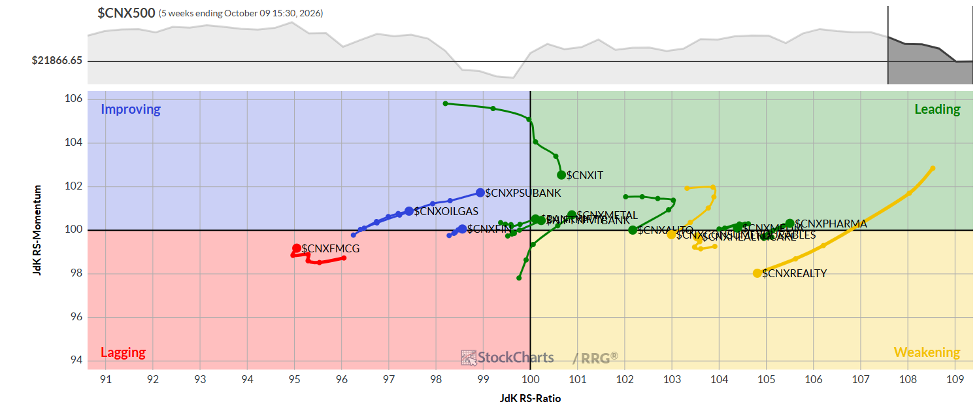
The Relative Rotation Graph (RRG) shows that the Nifty Bank Index has rolled inside the leading quadrant. Besides this, the Nifty IT, Pharma, Media, and Metal Indices are also placed in the leading quadrant. These groups may relatively outperform the broader markets.
The Nifty Auto Index has rolled into the weakening quadrant. The Nifty Midcap 100 and Nifty Pharma Indices are also inside this quadrant. Stock-specific performance may be seen, but overall relative performance from these groups may slow down.
The Nifty Infrastructure, FMCG, and Energy Indices are inside the lagging quadrant. However, all these groups are showing improvement in their relative momentum against the broader Nifty 500 Index.
The Nifty Financial Services and the PSE Indices have rolled inside the improving quadrant. This may indicate a likely onset of their phase of relative outperformance. The PSU Bank and Nifty Services Sector Indices are also placed inside the improving quadrant.
Important Note: RRG™ charts show the relative strength and momentum of a group of stocks. In the above chart, they show relative performance against the NIFTY500 Index (Broader Markets) and should not be used directly as buy or sell signals.
Milan Vaishnav, CMT, MSTA
Consulting Technical Analyst
www.EquityResearch.asia | www.ChartWizard.ae