Week Ahead: Without Triggers, The Technical Setup Stays as It Is; Watch These Levels

Nifty spent the week consolidating in a narrow range, ending on a negative note with its broader technical structure largely unchanged. The index oscillated in a 302-point range between 24,076.85 and 24,378.60, reflecting the continued absence of a directional trigger. Volatility eased further, with India VIX declining 4.64% to 10.68, keeping volatility expectations subdued. Nifty eventually closed at 24,175.65, registering a very mild weekly loss of 76.35 points (- 0.31%).
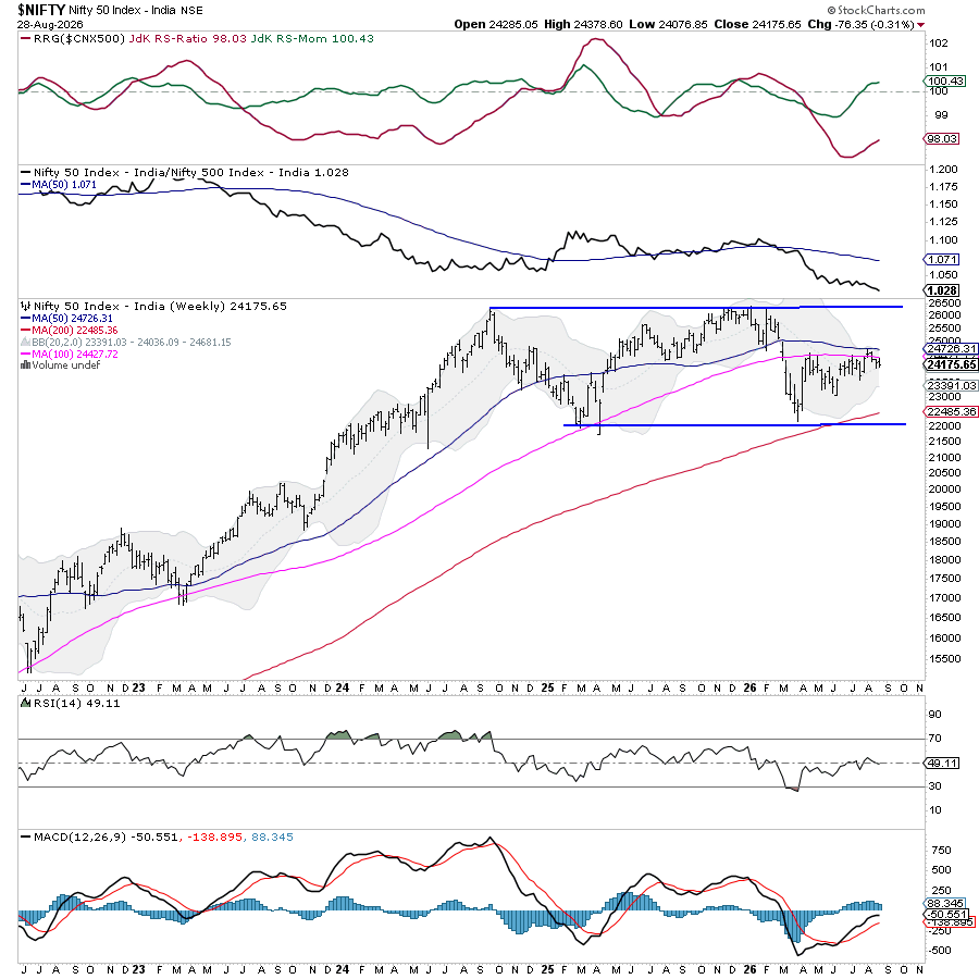
The technical structure remains unchanged from the previous week, with Nifty continuing to consolidate inside its established range. The 23,900–24,000 zone remains an important support area, while a significant cluster of moving averages overhead continues to restrict meaningful upside. Nifty is presently caught between these support and resistance zones and, unless either boundary is decisively violated, the index is likely to remain range-bound. A sustained move below 23,900 can invite incremental weakness, while a convincing move above the cluster of major moving averages in the 24,400–24,750 region would be required for the index to regain directional strength.
The coming week is likely to see a quiet-to-cautiously positive start, though the broader trading range may continue to dominate price action. Immediate resistance is expected at 24,330 and 24,500, while supports are likely to come in at 24,000 and 23,900. The weekly RSI stands at 49.11, remaining neutral and showing no meaningful bullish or bearish divergence against price. The weekly MACD remains below the zero line but is above its signal line, with the positive histogram indicating that downside momentum has moderated. The latest weekly candle has a relatively small bearish body and does not constitute an indecisive week.
Pattern analysis continues to suggest an extended consolidation. Nifty remains below its important long-term moving-average cluster: the 100-week MA is at 24,428, the 200-DMA is at 24,652, and the 50-week MA is at 24,729. Their proximity creates a formidable 24,400–24,750 resistance zone, making this area technically important for any sustainable breakout. At the same time, the 23,900–24,000 area continues to provide an important floor. Until either side is breached, the existing range should be respected.
Given this setup, aggressive directional exposure may not be rewarding while Nifty remains trapped inside the defined boundaries. Fresh buying should remain selective and stock-specific, particularly as the index approaches the overhead moving-average cluster, while existing gains should be protected at higher levels. Conversely, short positions should not be chased while the 23,900–24,000 support zone remains intact. The preferred approach for the coming week is, therefore, to remain selective, keep position sizes measured, and wait for a confirmed breakout or breakdown before adopting a stronger directional view.
Sector Analysis for the Coming Week
In our look at Relative Rotation Graphs®, we compared various sectors against the CNX500 (NIFTY 500 Index), representing over 95% of the free-float market cap of all the listed stocks.
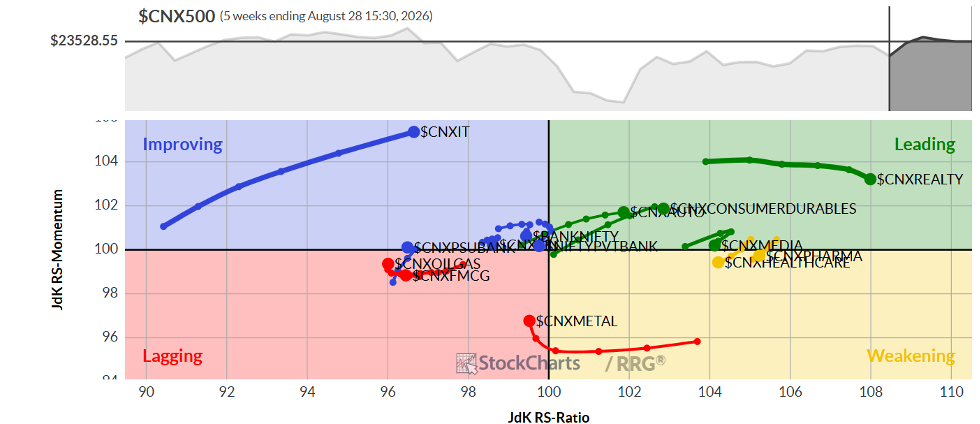
The Relative Rotation Graph (RRG) shows that the Nifty Media, Auto, and Realty Indices are inside the leading quadrant. These groups may relatively outperform the broader benchmark, i.e. the Nifty 500 Index.
The Nifty Pharma is inside the weakening quadrant, but it looks to be improving its relative momentum. The Midcap 100 Index is also inside the weakening quadrant. It may see some continued slowdown in its relative performance.
The Nifty Infrastructure and Energy Indices languish inside the lagging quadrant. The Metal and the PSE Indices are inside the lagging quadrant, but are seen sharply improving on their relative momentum against their benchmark.
The Nifty Financial Services, Nifty Bank, IT, Services Sector, and PSU Bank Indices are inside the improving quadrant; among these, the IT Index is showing strong rotation and is likely to continue to do so.
Important Note: RRG™ charts show the relative strength and momentum of a group of stocks. In the above chart, they show relative performance against the NIFTY500 Index (Broader Markets) and should not be used directly as buy or sell signals.
Milan Vaishnav, CMT, MSTA
Consulting Technical Analyst
www.EquityResearch.asia | www.ChartWizard.ae