3 Timeless Trading Rules for Navigating Today's Market
August is usually one of the quieter months in the stock market. But September often brings more activity. Given that it’s the final weekend of August, now is a good time to make sure you’re prepared for whatever the stock market throws your way.
I thought this would be a good time to revisit some words of wisdom from legendary trader Jesse Livermore. Here are three that stood out to me from his book How to Trade in Stocks.
When Does a Stock Act Right? Livermore observed that when a trend begins, a stock may advance for several days and then pull back. What matters is how the stock behaves afterward and whether it continues making progress in the direction of the trend.
You can watch the price action directly on a chart, or you can use indicators to help identify changes in behavior. One indicator I like for this is the Distance from Moving Average.
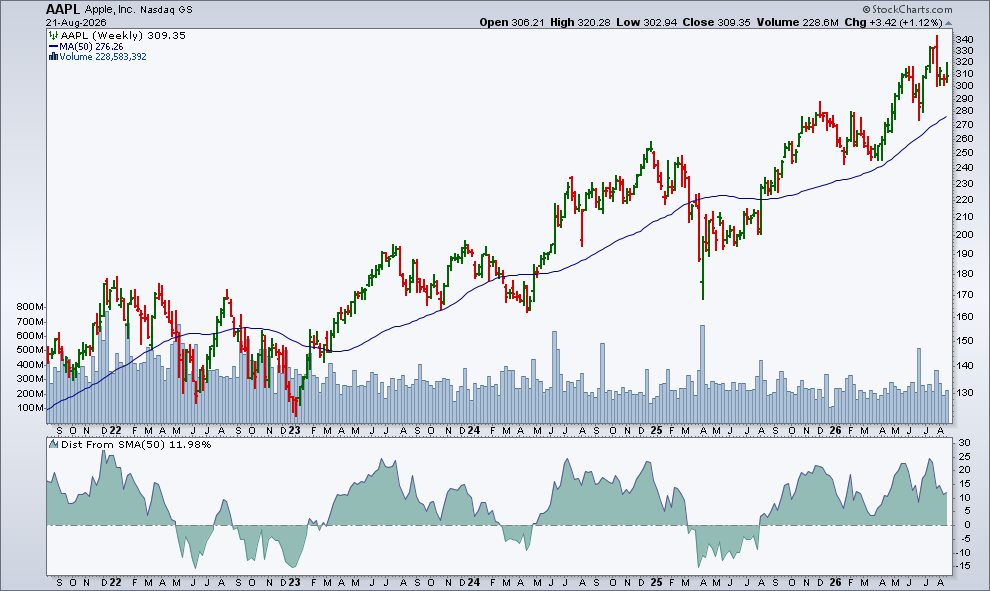
The weekly chart of Apple (AAPL) below displays the Distance from Moving Average indicator in the lower panel using the 50-period moving average. Notice that, over the past five years, AAPL has spent more time above its 50-week SMA than below it. There are times the indicator fell below zero, but the stock recovered after those moves. A cross above the zero line or a bounce from close to the zero line aligned with the stock's pullbacks.
Understanding Industry Group Action is Essential to Successful Trading. Livermore also recognized that industry groups and sectors tend to move together, which is why it helps to know which areas of the market are leading and which are lagging. Livermore believed traders should focus on the strongest stocks within the strongest industries.
Relative Rotation Graphs (RRGs) are an excellent way to monitor sector rotation, as are StockCharts MarketCarpets. Pull up a weekly RRG chart of the S&P 500 Sector ETFs and you can quickly see which sectors are leading, improving, weakening, or lagging. If you’d rather have someone walk you through that rotation, Julius de Kempenaer publishes a weekly update of the U.S. sectors that can help keep you on top of the changes.
Once you identify a leading sector, pull up its MarketCarpet and see which stocks are moving the most. Click here for an example of the 5-day change of the Health Care sector MarketCarpet.
Determine the Line of Least Resistance. Once you’ve identified the strongest stocks in the strongest sectors, determine the trend direction. Then, see if the trend lines up with what you’re seeing in the sector or industry group and the broader market.
For example, if Merck & Co (MRK) stands out as one of the stronger Health Care stocks, pull up its chart, add the Price Performance indicator in the lower panel, and compare the performance of MRK with the Health Care Sector Select SPDR (XLV). From the chart, you can see that MRK is outperforming XLV.
If the stock’s trend aligns with the broader market and sector, the next step is deciding when to enter a position. Ideally, you want to enter on a pullback, and an indicator such as the Distance from Moving Average can help you identify that.
This is just one way to combine these timeless market principles with the tools available in StockCharts. As the dog days of summer wind down, spend some time exploring these tools and building them into your own process. When trading volume picks up, you’ll know what to watch.
Enjoy the weekend!