Weakening Market Breadth Could Signal Trouble Ahead
The S&P 500 remains in a primary uptrend, defined by a consistent pattern of higher highs and higher lows. As such, I’m inclined to consider this market “guilty until proven innocent” based on this general bullish technical structure. But that also means that I’m always reviewing the evidence for signs of a bearishness that may not yet be reflected on the chart of the SPX.
With that in mind, here are three market breadth indicators that are starting to show signs of bull fatigue. And while our growth-dominated benchmarks are still in great shape because of the strength in tech, the weaker breadth conditions could be an early warning sign of problems to come.
Advance-Decline Lines Starting to Break Initial Support Levels
While the trend in the S&P 500 remains positive, some would argue that the cumulative advance-declines provide a much more effective illustration of the “true” trend for stocks. These trends remain positive as long as the A-D lines sit above their 50-day moving averages, but that trend barometer is beginning to fail for some areas of the equity space.
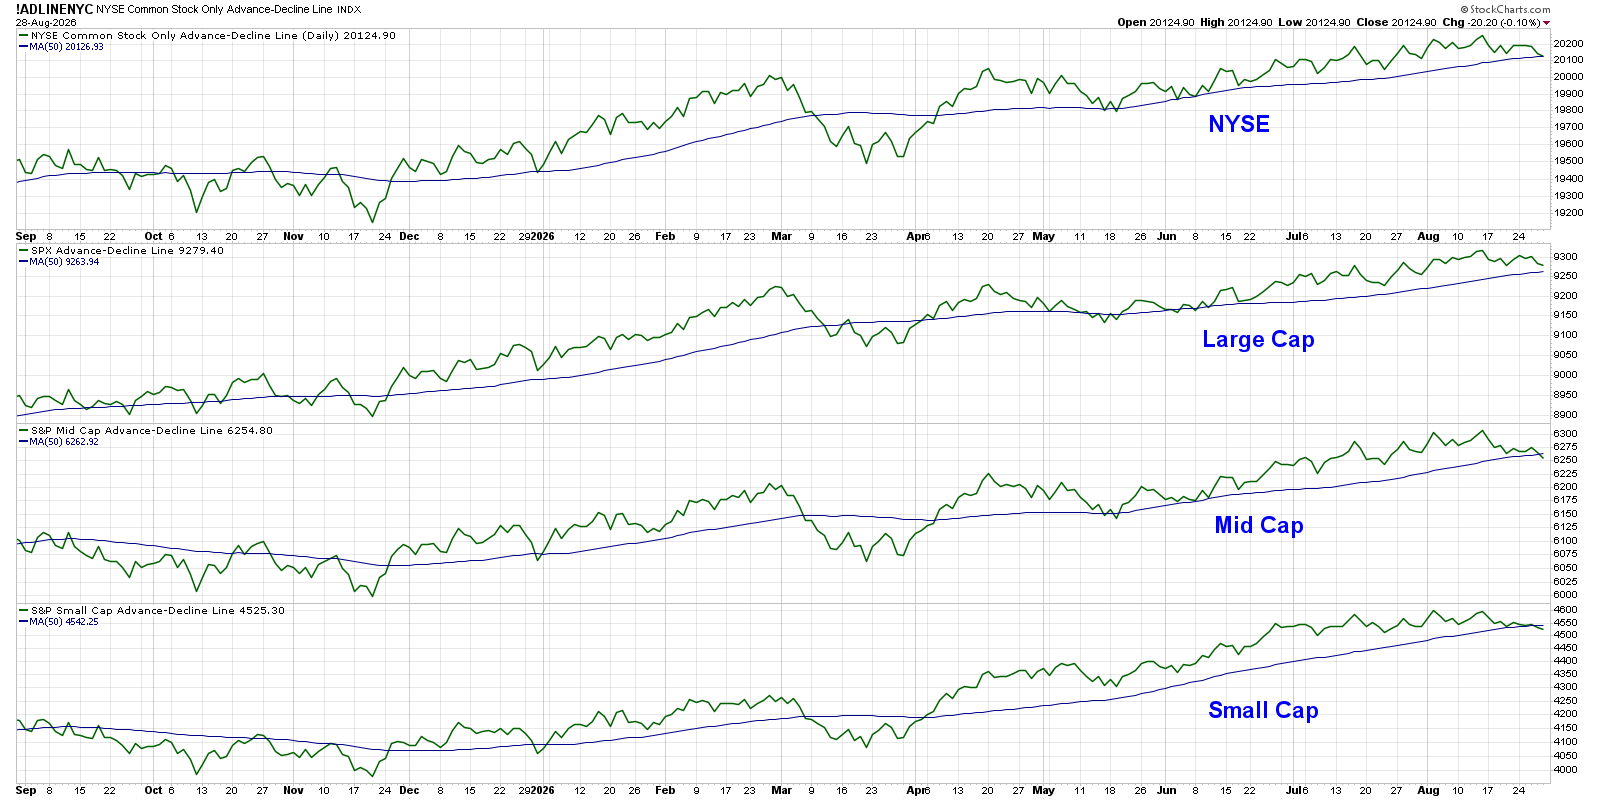
The NYSE advance-decline line pulled back to its 50-day moving average this week, while the S&P 500 mid-cap and small-cap versions ended the week just below the 50-day moving average. Is this the “end of the world” in terms of breadth conditions? Absolutely not. But does it speak to the fact that the trend at the stock level is not necessarily matching the bullishness on the S&P 500 chart? It definitely does.
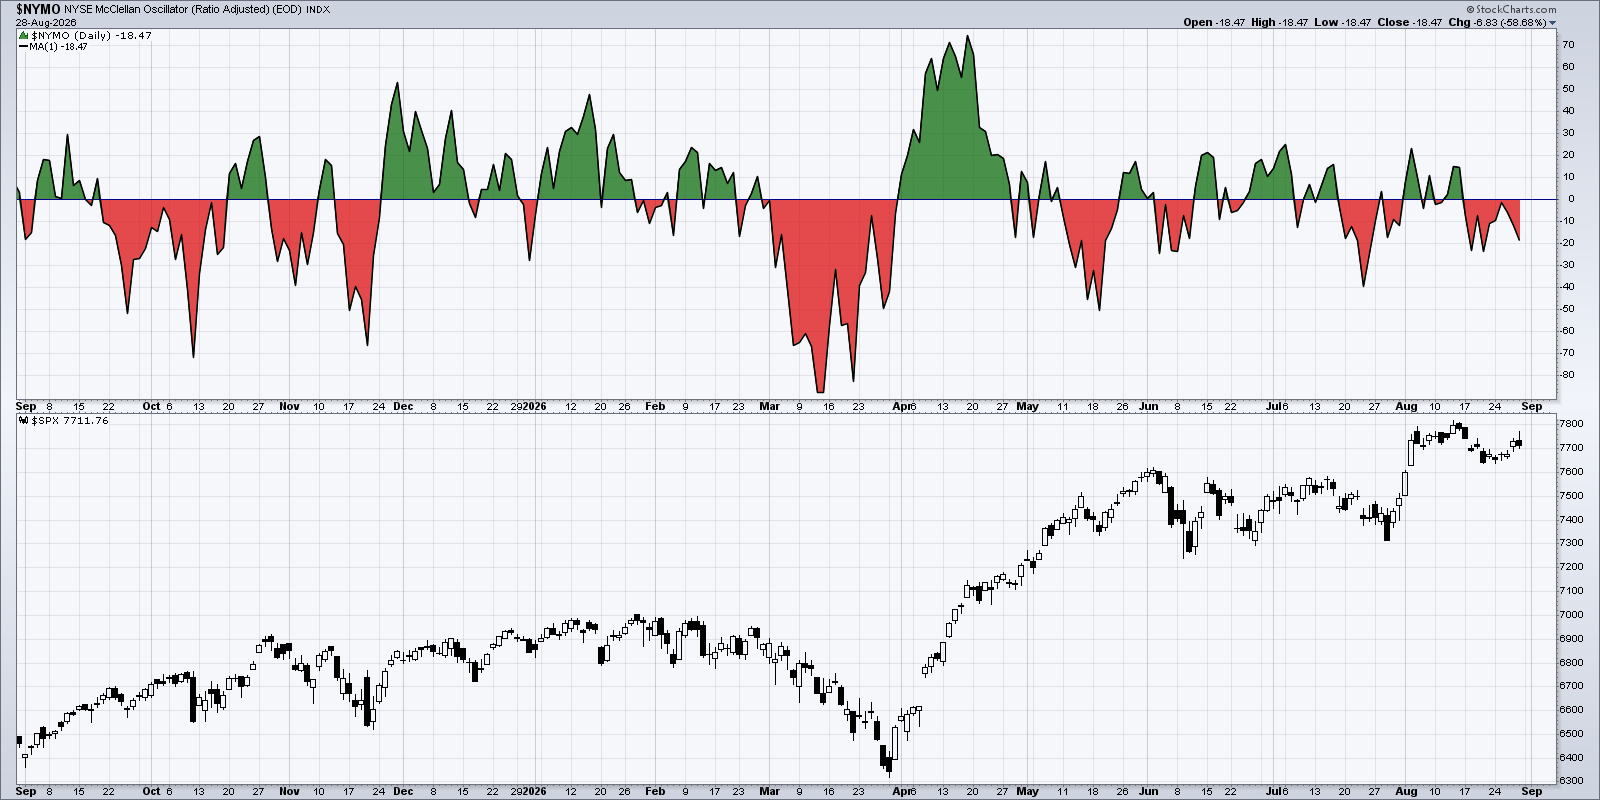
We can also measure the short-term trend in advance-decline data using the McClellan Oscillator. This indicator turned negative in mid-August, soon after the SPX tested 7800 for the first time in history. And even though the S&P turned back higher this week, the McClellan Oscillator remained below the zero level. Until this indicator can pop back above zero, the short-term market breadth appears to be quite challenged.
Lack of New Highs Implies Weaker Buying Power
A healthy bull market is usually driven by an expansion in new 52-week highs. Even if the major indexes are not making new highs, a decent number of individual stocks doing so can speak to the strength underlying the equity markets. Unfortunately, we’ve observed a general decline in new 52-week highs through August.
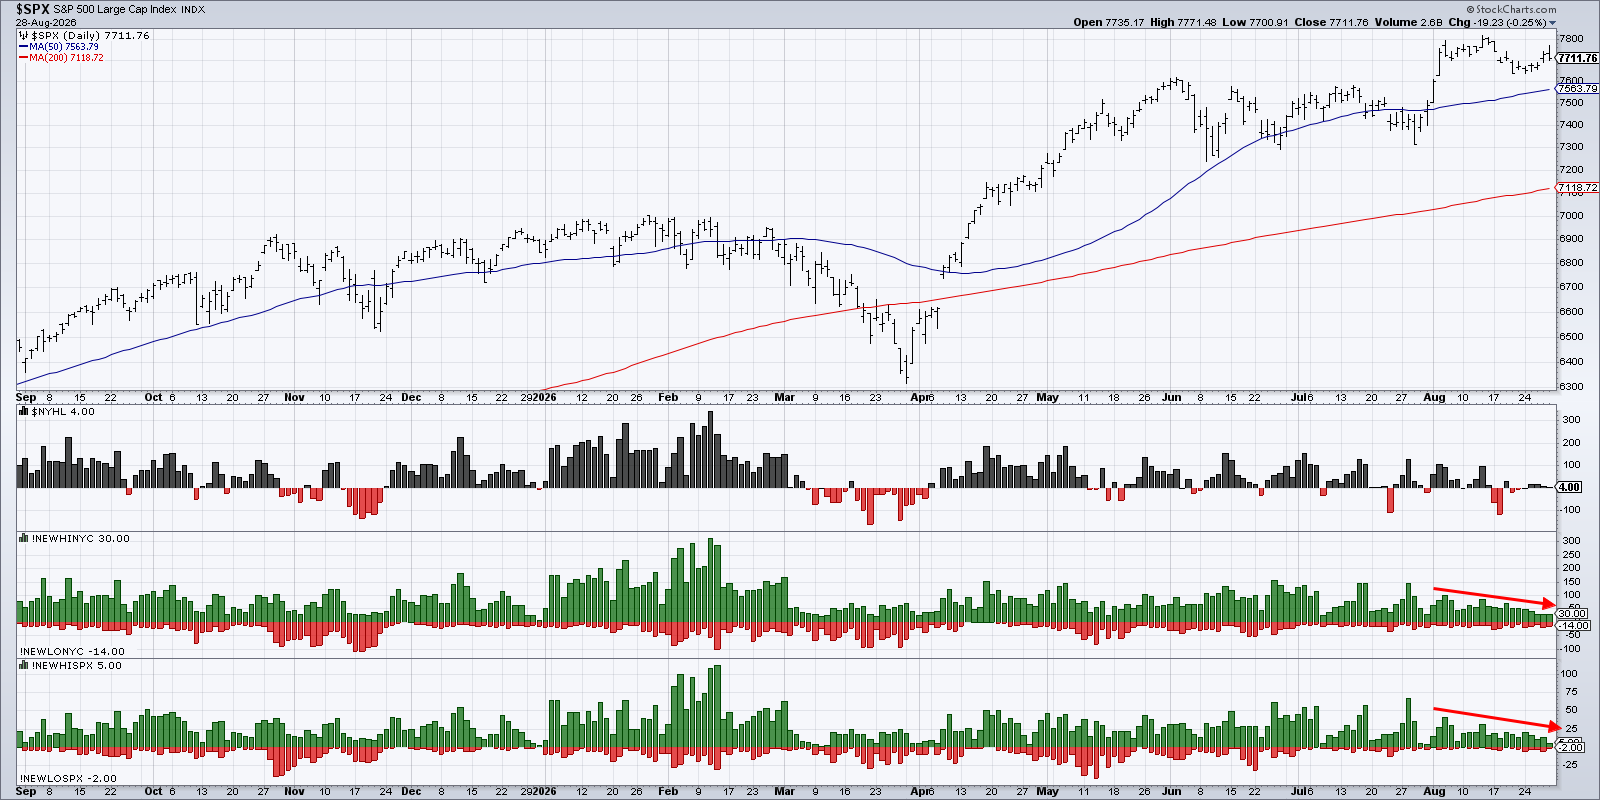
Generally speaking, about 10-12% of the S&P 500 members will be making new 52-week highs during a healthy bull market phase. This week, it was more like 3-4%. On Friday, it was down to only 1% of S&P 500 members achieving a new high for the year. With few names driving this market higher, that implies little upside support for the major equity benchmarks.
Moving Average Breadth Readings Suggest Breakdowns Have Already Begun
Perhaps the most concerning chart involves the percent of stocks above key moving averages. Just over 70% of S&P 500 members finished the week above their 200-day moving average, which is actually a very strong bullish reading. But only 54% of the index constituents remain above the 50-day moving average, down from 70% in mid-August.
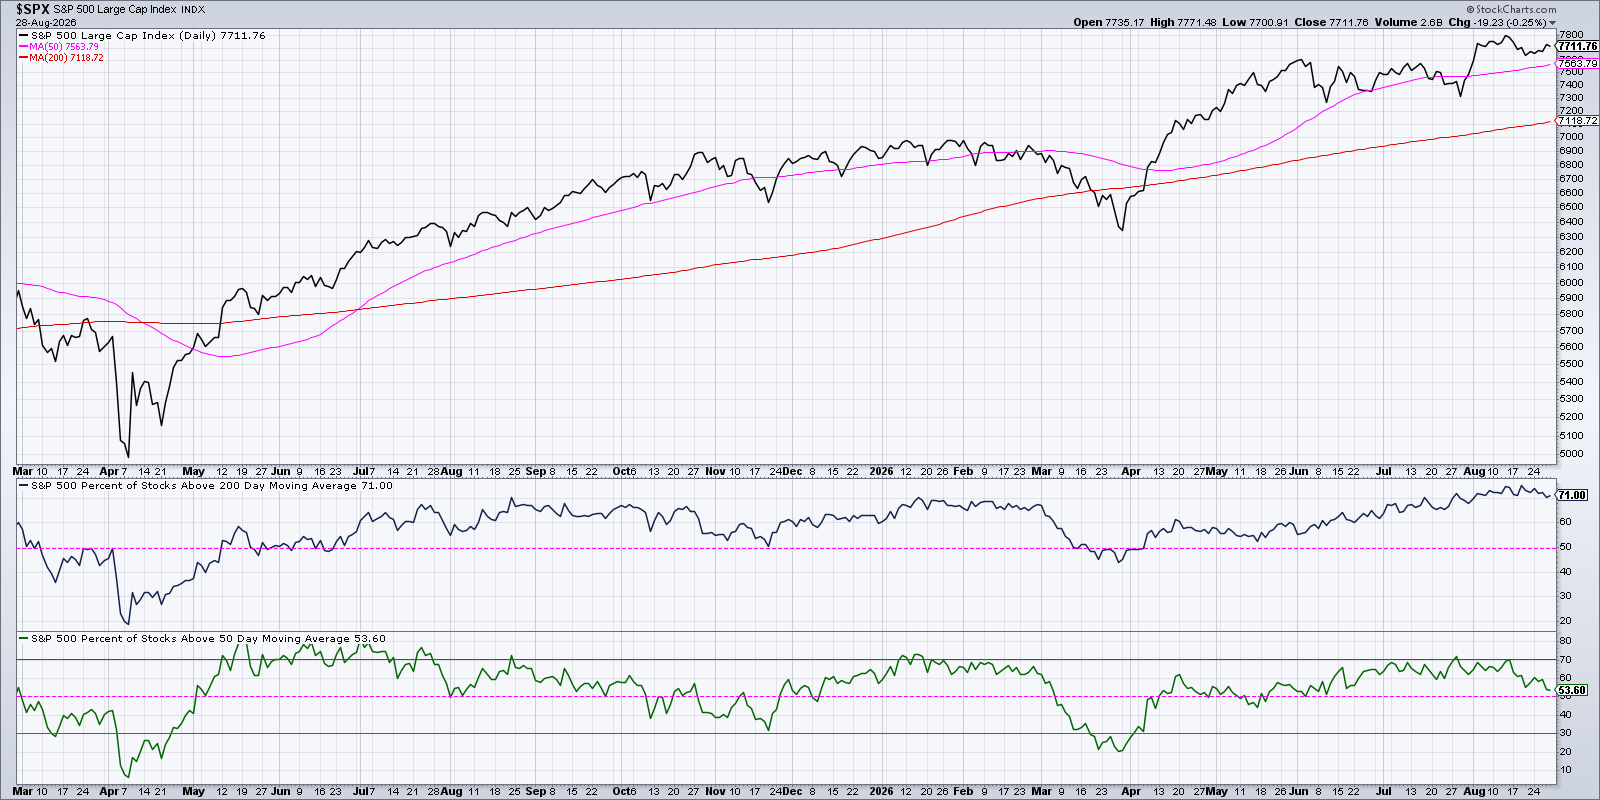
I usually consider anything below 50% to be a bearish reading, so these indicators both remain in a bullish framework. But as more and more individual stocks fail to hold the 50-day moving average, this means a lack of willing buyers to provide essential price support in stocks that are pulling back. Should the indicator dip below 50% next week, that would raise a serious red flag for the Great Bull Market of 2026.
I was taught that “Price is King”, so, as long as the S&P 500 holds our initial support around 7600, I’m not going to get too concerned. Given the deterioration of key market breadth indicators in recent weeks, though, a breakdown scenario may indeed be in the cards as we rotate into the seasonally weakest part of the calendar year.
We addressed seasonal volume trends and other viewer questions in our latest mailbag episode of CHART THIS with Dave Keller. Check out all the insights over on our YouTube channel!
RR#6,
Dave
P.S. Ready to upgrade your investment process? Check out my free behavioral investing course!
David Keller, CMT
President and Chief Strategist
Sierra Alpha Research LLC
marketmisbehavior.com
https://www.youtube.com/c/MarketMisbehavior
Disclaimer: This blog is for educational purposes only and should not be construed as financial advice. The ideas and strategies should never be used without first assessing your own personal and financial situation, or without consulting a financial professional.
The author does not have a position in mentioned securities at the time of publication. Any opinions expressed herein are solely those of the author and do not in any way represent the views or opinions of any other person or entity.