Bank Earnings on Tap: Is the Financials Sector Selloff a Q4 Buying Opportunity?

Key Takeaways
- XLF fell nearly 10% from its September peak but has rebounded off key technical support, suggesting a potential late-year recovery.
- Bank earnings, inflation data, and Treasury yields could shape the next move for Financials, along with calendar tailwinds.
- Regional banks face a tougher technical setup than larger peers, with weak momentum and significant overhead resistance weighing on KRE.
Get ready for an action-packed week on Wall Street. Fed speak will kick things off, highlighted by words from Governor Waller Tuesday morning. From there, eyes will turn to the September CPI report, due out Wednesday before the bell. The inflation backdrop to wrap up the third quarter likely wasn't pretty, given the massive rise in energy prices (namely diesel). The Fed's Beige Book of regional economic activity arrives the following afternoon.
PPI hits Thursday in the premarket, and we'll then have a good grasp on last month's PCE inflation. From there, the spotlight will be on the consumer when Retail Sales crosses the wires. September import/export prices and Friday's options expiration round out the busy stretch.
And, oh, by the way, Q3 earnings roll in, too. It should be another banner season. FactSet forecasts a more-than-robust 29.6% S&P 500 YoY EPS growth rate. If that verifies, it would mark the third straight quarter of 25%-plus bottom-line gains. SPX profits continue to soar to new records, amid impressive EPS trends internationally and among domestic SMID caps. Everything is coming up roses, right?
The Fallout in Financials
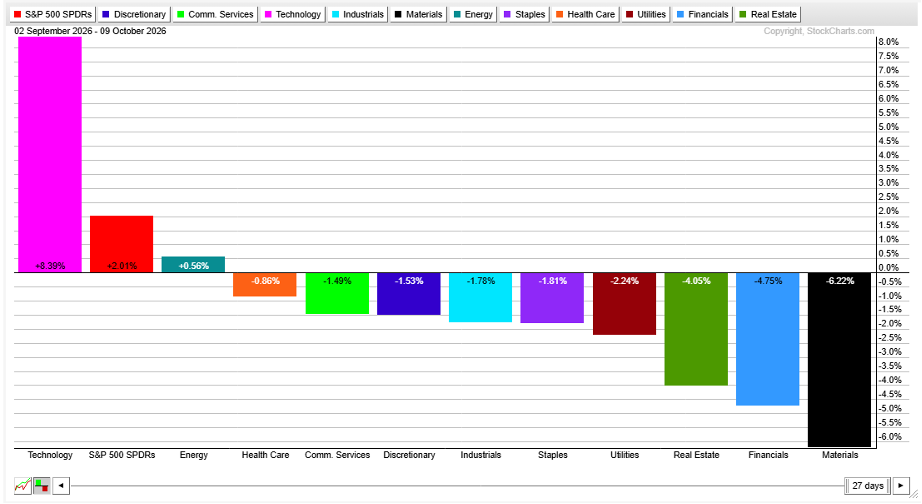
The Financials Select Sector SPDR Fund (XLF) fell 9.88% (a smidgen short of a technical correction) from its September 3 peak to a low notched on the first of this month. Over that time, XLF was the second-worst-performing S&P 500 sector ETF.
JPMorgan Chase (JPM), Wells Fargo (WFC), Citigroup (C), and Goldman Sachs (GS) serve up results Tuesday morning, followed by Bank of America (BAC), Morgan Stanley (MS), and BlackRock (BK) right before the CPI report is published.
Much hinges on outlooks from bank executives, but what does the chart say? Is this Financials sector dip buyable? Let's check it out.
New Macro Fears, But a Classic Seasonal Correction
The chart below shows that XLF endured a run-of-the-mill correction, falling fast over four weeks. Regardless of the macro catalysts, the chart offered clues pointing to a seasonal swoon. For one, the ETF achieved its measured-move upside price target based on a first-half bottoming pattern and June breakout. The cup-with-handle formation targeted $59, and that was just about tagged in early September.
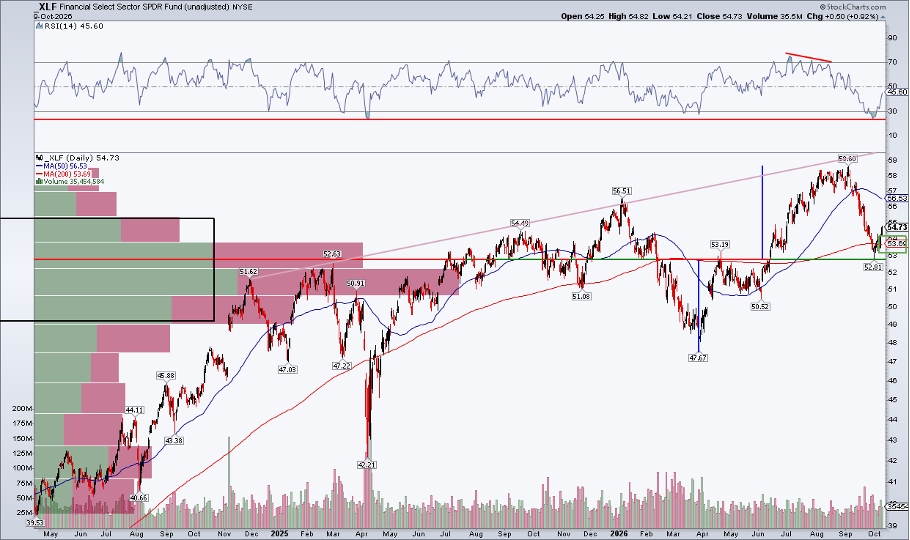
Next, trendline resistance came into play as XLF encroached on $60. Moreover, the fund's RSI momentum oscillator at the top of the SharpChart printed bearish negative divergence relative to price leading into Labor Day. From there, it was a quick retreat, and XLF declined to its rising 200-day moving average. That trend-indicator line bears watching; we don't want to see it inflect downward. Interestingly, the 200-DMA has a history of being a point of polarity (going back 12 months).
I'm encouraged by XLF's best two-day rally in six weeks coming into bank earnings week and that previous resistance in Q2 at $53, for now, holds as support. Finally, XLF dipped into a notable area of congestion, as measured by the volume-by-price profile on the left side of the chart above.
Bulls Love the Midterms
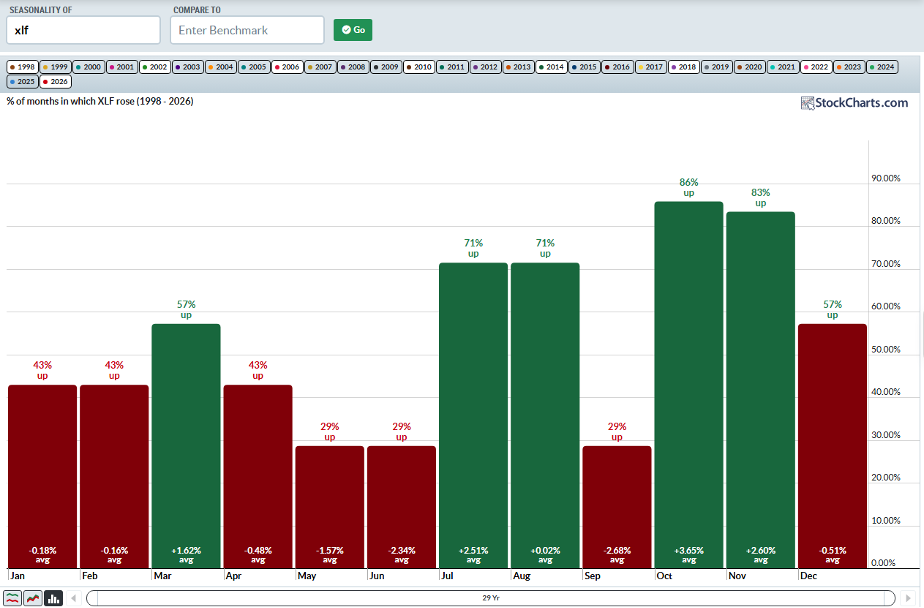
The upshot? Most technical signs point to a bounce. This week will be about how bank stocks respond to Q3 reports. Also, keep in mind that it's a very bullish time of year. Seasonal tailwinds are gusty in October and November for the Financials sector.
In data going back to 1998, XLF has returned 3.65%, on average, in October midterm years, followed by a strong 2.6% mean November gain. Positivity rates are gaudy: 86% and 83%, respectively.
Big > Small
So the cap-weighted XLF ETF may be poised for some Q4 strength. Smaller banks face bigger challenges, in my view. Here's a look at the SPDR S&P Regional Banking ETF (KRE).
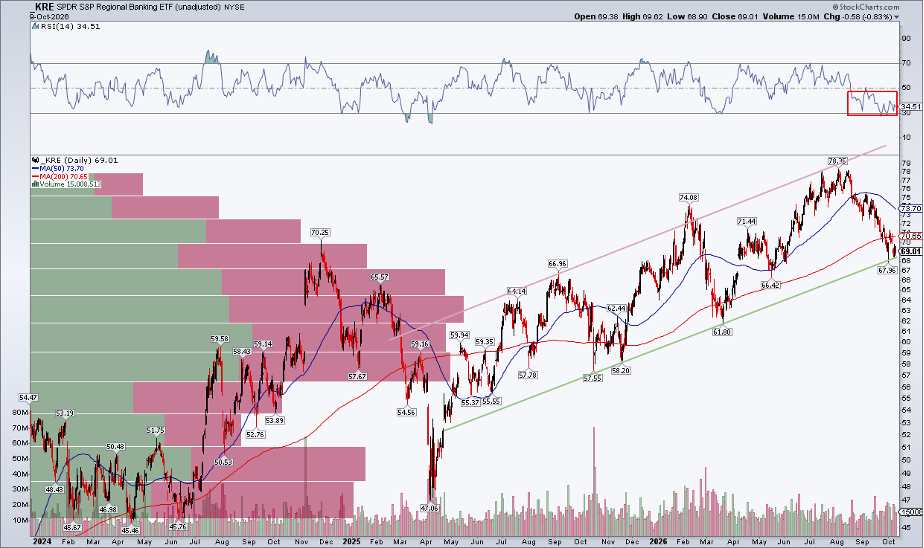
At a high level, KRE is at the lower bound of an uptrend channel, auguring for another buy-the-dip idea. But I'm not a fan of the consistently low RSI gauge (ranging in the bearish 20-to-60 zone), and KRE's 200-DMA could roll over and turn negative in its slope soon. Significant congestion lies above today's level, perhaps pointing to churning price action.
The fund is below its November 2024 highs, which represents massive relative weakness (considering the S&P 500 is near records).
Don't Fear the Rates Reaper
Zooming out and taking an intermarket perspective, I assert that Financials stands to benefit if the recent rate rise merely cools. XLF selling may be overdone, as the group is typically not an extremely yield-sensitive space. Investors may soon realize that the bank babies were thrown out with the other cyclical bathwater.
Overall, last week may have been the beginning of a Q4 comeback. We'll see what Jamie, Jane, Charlie, David, Brian, Ted, and Larry have to say. But price matters most.
The Bottom Line
The XLF correction looks buyable in my eyes. Macro pressures, intermarket trends, and a dose of AI fear contributed to the decline, but the chart had signaled some September weakness. As the ETF hit support, a strong rally played out to wrap up last week. Earnings provide the next catalyst this week.
Disclaimer: This blog is for educational purposes only and should not be construed as financial advice. The ideas and strategies should never be used without first assessing your own personal and financial situation, or without consulting a financial professional.