StockCharts Insider: 10 Screener Mistakes That are Sabotaging Your Trades
Before We Dive In…
Nobody associates stock screeners with lost time, opportunity, and money. But a mishandled screener can deliver those as quickly as it can the opposite. StockCharts’ Screener is a powerful tool, but, if you steer it the wrong way, you’ll end up with either nothing, mismatched results, or a handful of bad results that somehow look convincingly good. So, let’s not do that. Here are the ten common mistakes users make, and how to fix each one before it costs you more than just “the cost of doing business.”
1 - Stacking Filters Until There’s Nothing's Left
It’s like an “everything but the kitchen sink” approach. Up this week over 10%. Low P/E. High ROIC. RSI crossed above 30. MACD crossover. Chaikin Money Flow above the zero line. Bullish engulfing pattern.
This might seem like precision, but it’s not. You hit “run” and end up getting zero results. If you’re (un)lucky, you get a few questionable stocks nobody’s heard of.
The Fix: See what you get with only three filters. Then check the charts. If you need more, carefully add filters, but watch the results and be sure to chart them.
2 - Fighting the Dropdown Menu Instead of Customizing a Scan
You’re trying to nail an exact condition. You have a hyper-specific RSI range or SCTR level. So you keep clicking and clicking and tweaking filters. You're wasting time doing this by hand when Convert to Scan does it for you.
The Fix: Build the search framework until it’s 90% there. Then, hit Convert to Scan and finish the last stretch in the Advanced Scan Engine. The Screener is a sharp tool but, compared to a Scan, it’s relatively blunt. So don’t force a blunt tool to do hyper-precision work.
3 - Never Touching the Group Filter
You’re thinking “why am I not getting enough tech companies, or small-caps, or blue chips?” You probably forgot to check the default Group filter, which is set to the S&P 100.
The Fix: Before you begin your screening process, check the Group to see which stock universe you’re focusing on. You’ll find major US stocks, several S&P and Dow indexes, and the NASDAQ 100 for a tech-heavy search.
4 - Getting "Time" Wrong… In More Ways Than One
You pair a fast-moving Full Stochastic reading that reacted to this morning's price action against a Revenue Growth (TTM) read that updated last quarter. It's okay as long as you know what you're doing. You’re stacking filters that run on different clocks. Just be aware when you're stitching together potential incompatibles.
The Fix: Timing the market is difficult enough, so you should always know which “time” you’re using when you add filters. Technicals and fundamentals move at different speeds; some lead, others lag. It's important to know the difference.
5 - Forgetting That Screener Results are Frozen in Time
The Screener gives you a comprehensive “snapshot” of stocks in certain conditions. As you know, snapshots are frozen pictures. A stock with an SCTR above 80 looks great. But what if it was falling from 95? It might be a green light. Or not. It depends. Screener results are always moving—to somewhere and from somewhere.
For example, look at the charts below. All three have SCTR values between 80 and 90.
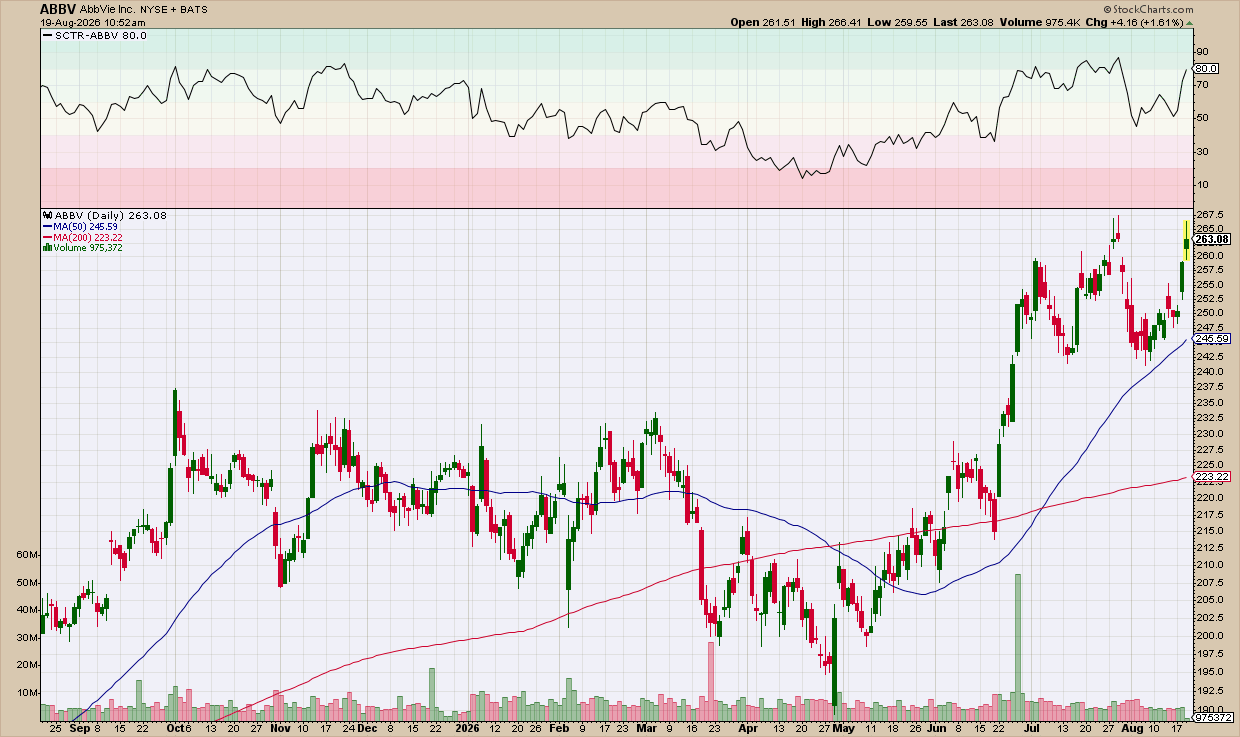
ABBV’s rise followed six months of choppy movement and two months of declines. The last candle shows it attempting to test a high a third time. Is it topping? Don’t know for sure. But it might not look like the best “long” opportunity of the bunch.
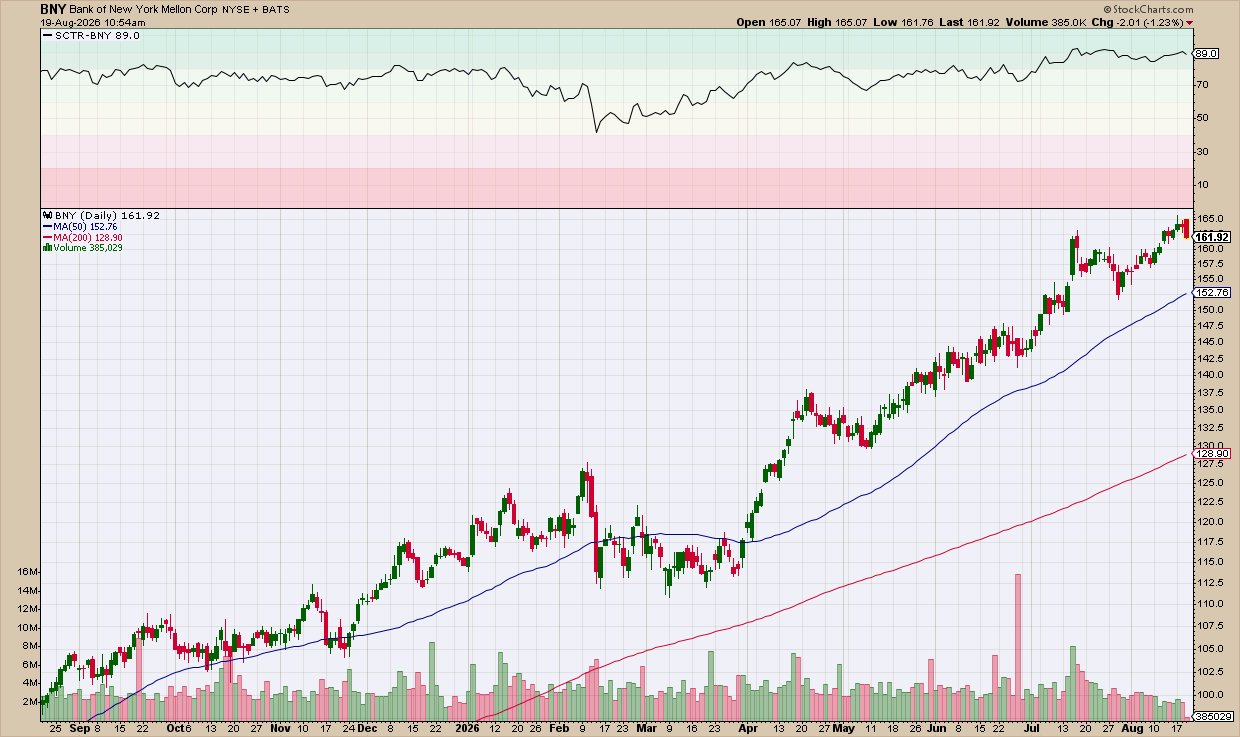
Look at the smooth trending motion here. Also, notice how the 50-day and 200-day simple moving averages are spread out in “full sail.” Compared to the last example, this one seems better, don’t you think? Same Screener reading, but totally different scenario.
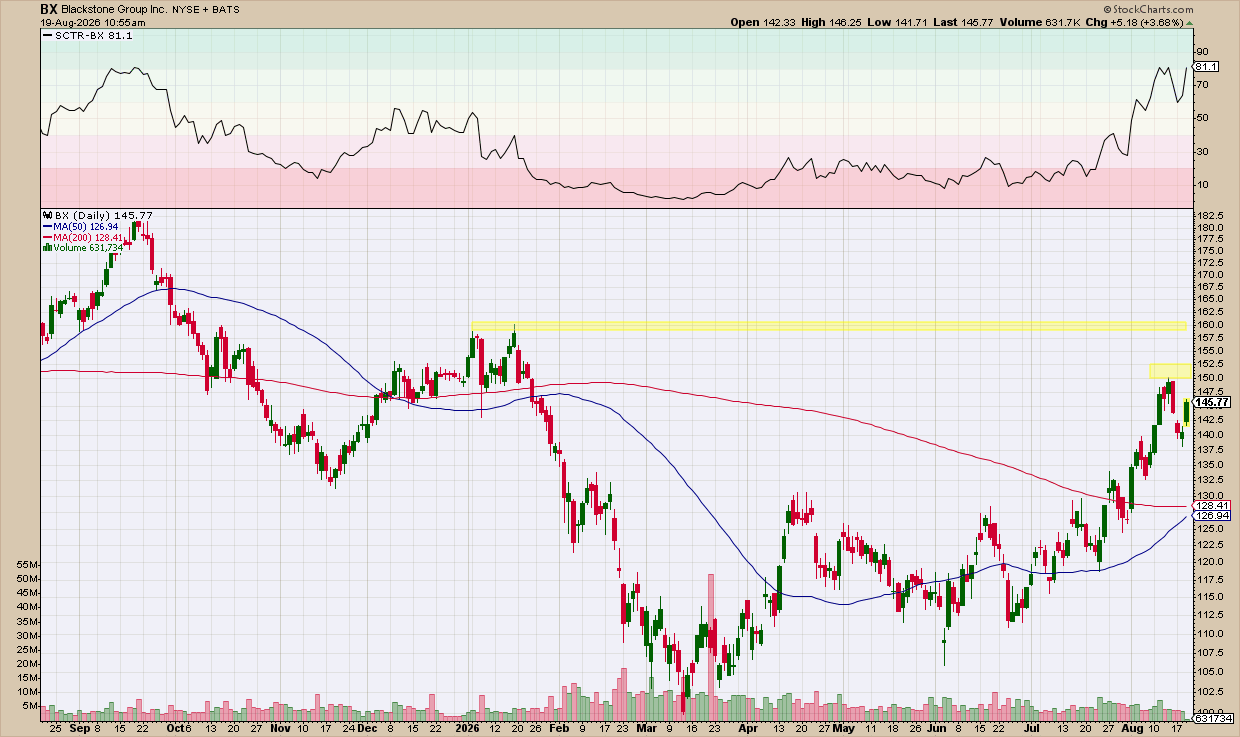
Another Screener result showing a strong SCTR reading. Here, though, the 50-day SMA is still below the 200-day SMA, though it looks to be attempting a crossover. BX is showing signs of a bullish reversal from a yearlong downtrend and it has two major levels of resistance to clear, both of which are highlighted in yellow.
The point is that the same Screener reading can yield very different contexts and setups.
The Fix: Screen for results, but chart for context.
6 - Setting Filters That Don't Actually Make Sense Together
You’re filtering for massive revenue growth but with a rock-bottom P/E. Or maybe you’re filtering for high revenue growth stacked with a low Price to Free Cash Flow. A stock growing around 40% a year almost never trades at a P/E of, say, 8. And a fast-growing company rarely shows a low Price to Free Cash Flow either, unless it has an unusually high cash burn rate while they reinvest.
The Fix: I know that, at StockCharts, we’re primarily market technicians. Still, if you’re going to use filters that concern a stock’s actual “business,” know the business numbers before you start using them.
7 - Skipping the Screener the Second a Stock Goes Viral
So, you logged onto a group chat, or you saw something on Reddit, or TikTok. Suddenly, all the filters go out the window. Buy it now or miss out? No. Better to pause. You don’t want to get into the clutches of FOMO.
The Fix: Here’s where you use the Screener backwards, as a FOMO check. Does it follow any of the criteria you’ve set for yourself? Chart the viral stock. It might clear your own merits. If so, great. If it doesn’t, then analyze it more closely. It’s possible that the only thing driving it up is hype. So, it’s a short-term trade? Chart it out as a speculative trade before you jump in.
8 - Chasing Cheap Instead of Chasing Liquid
Filtering for stocks between $1-$10 or something near that range may seem like a way to buy more shares for your money. If you’re not careful, what you may end up actually buying is volatility, and a stock that's easy to manipulate.
The Fix: If you’re filtering for cheap stocks, be sure to add Average Volume (50-day) - Above 500K and SCTR - Above 60. Remember that price tells you very little about quality. This should help.
9 - Running the Same Screen No Matter What the Market's Doing
It’s the “cookie cutter” method of stock hunting. You built a screen that worked well six months ago, so you keep on doing it. But maybe the market has gone from calm and trending to choppy and indecisive. Your screen criteria might not work in this new environment.
The Fix: Economic conditions underlying market moves change. Perhaps some fine-tuning can help. Build separate versions for different conditions—bullish and trending, choppy and indecisive, bearish and trending, etc. Know what’s going on in the broader markets and economy before combining your filters.
10 - You Treat the Results List Like It's Already a Portfolio
The stock list below looks pretty strong. It’s a little tech heavy, but most are trending strongly. I found these using a single search.
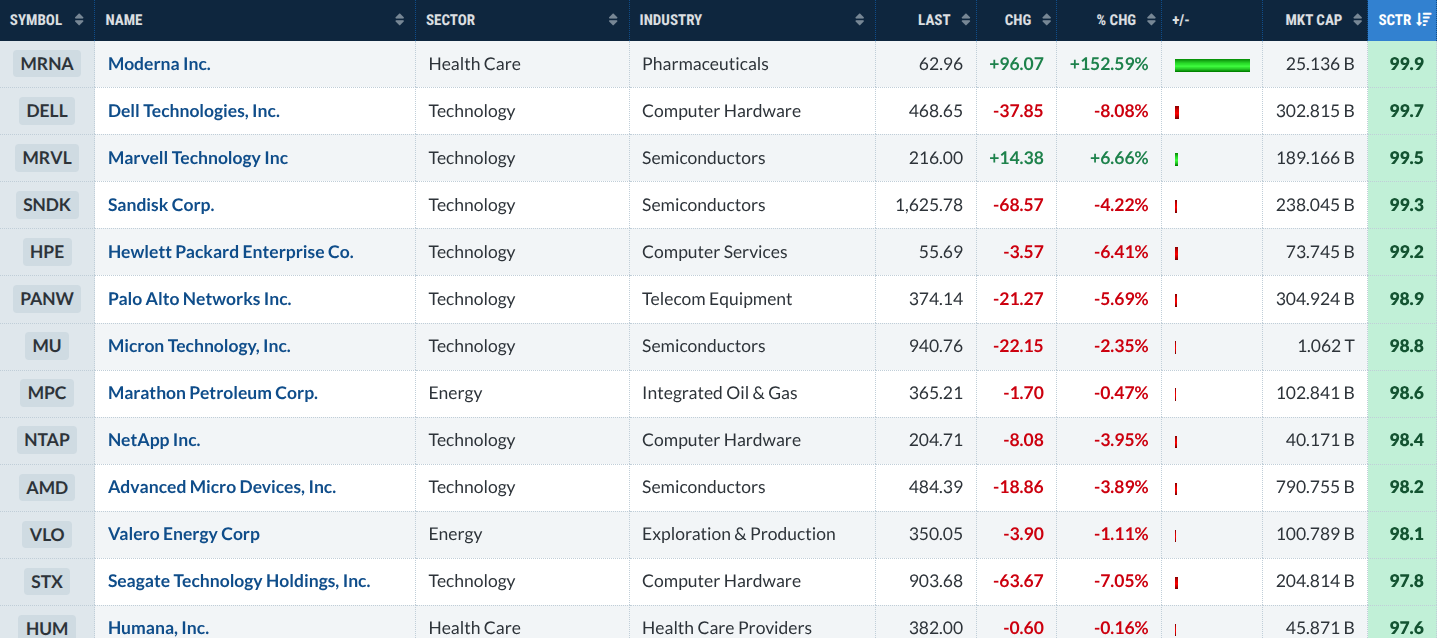
If you look at the individual charts, however, some look over-extended, some are in perfect buy zones, and some are pulling back to critical support for a bounce or further decline. Still, their structures are similar. They’re all bullish. But if the economic weather turns against a given sector or industry, like tech or semiconductors, a good portion of this selection may fall.
The Fix: The Screener's job is to turn hundreds or thousands of stocks into a few worth your attention. It’s not there to hand you a portfolio. Treat the results as a shortlist rather than a buy list. Pull up the chart, check the setup, and do the last bit of thinking before anything gets bought.
The Bottom Line
Anyone can make these mistakes. They stem from the same batch of bad habits traders and investors often make. Fix the habit, not just the screen, and the Screener starts working in your favor. Remember that the "cost of doing business" can mean losing money to mistakes, or spending the time and effort it takes to do things right instead. The latter is a "cheaper" price to pay.