StockCharts Insider: Insider Screener Setups for Swing Traders
Before We Dive In…
Swing traders operate on relatively narrow time frames. They hold positions for days, maybe a week or more. If you’re looking for swing trading opportunities, fundamentals may be lower on the totem pole of criteria. You’re looking for technical setups, often from different angles.
The Screener’s Technicals, Chart Patterns, and Price/Performance categories seem built for this kind of opportunity hunting. After experimenting with it myself, I’m going to suggest 10 combinations for you to look at. Each is based on a specific swing trading idea, and I'll explain the logic behind each screen. Look at each one. Keep what works. Tweak them. And if you have a better idea, design one of your own.
How to Use (and Not Use) These Screener Combinations
One BIG caveat: Many of these scans capture what price is doing at the moment. They don’t capture movement, they don’t capture longer-term price history, and they don’t capture the wider context. Context is not so much a backdrop as a large machine with moving parts. This is where you do the thinking, so stay agile in your approach and analysis (always).
A few ground rules:
- Use the SCTR column in the Screener results to further compare selected stocks.
- Always check the chart for favorable price action.
- Note that some Screener combinations have such tight criteria that results will be infrequent. When they do happen, though, those are the ones worth your attention.
For example, take a look at the chart below. I used the first combination to generate results, and this was one stock on the list.
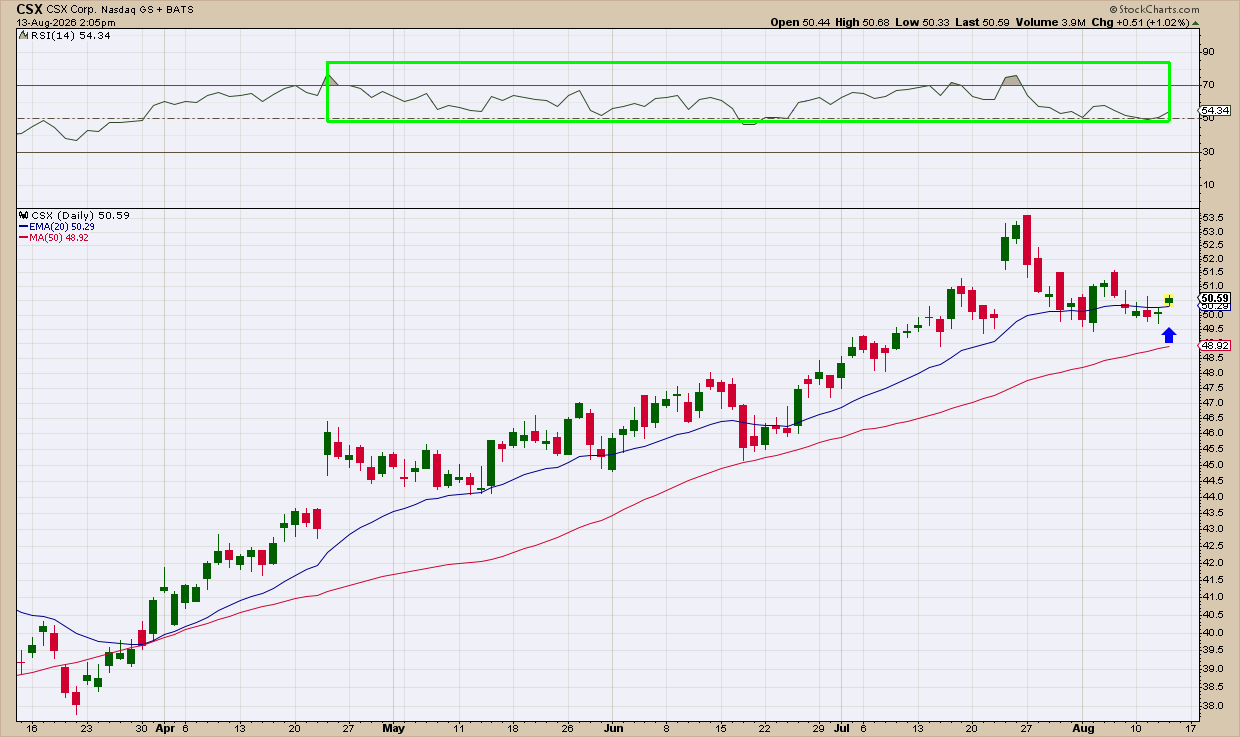
Is this a tradable scenario? The 20-day EMA is above the 50-day SMA. The RSI is in a bullish range. Price just crossed above the 20-day EMA. It’s clearly in an uptrend, but when, where, or if you decide to enter for a short-term swing trade is up to you.
Now compare it with another result:
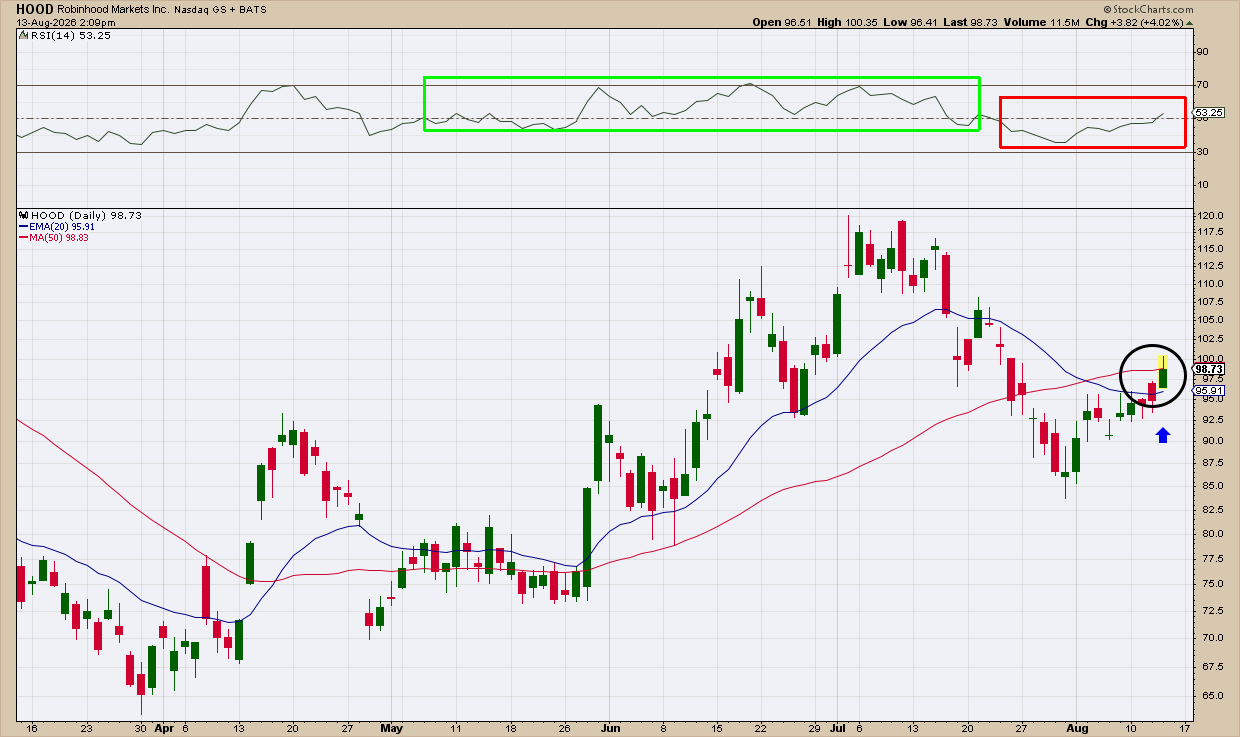
This one’s problematic. Yes, price crossed above the 20-day EMA. For a moment, price was above the 50-day SMA. But the 20 is below the 50, which signals a downshift in momentum. The RSI also began entering a bearish range. So is it a bullish swing trade prospect, a bearish fading prospect, or a “stay away” candidate? That's your call.
What I’m trying to point out here is that a single combination will give you a range of stocks to choose from. Use your own discretion when making a selection.
1 - Short-Term Trend Dip
50-Day SMA: Price Above + 20-Day EMA: Price Crossed Above + SCTR Value above 60
As you know, a trending stock doesn’t move in a straight line. In this setup, the short-term moving average (20-Day EMA) aims to capture the moment “impatient money,” once shaken out, resumes its upward movement. That’s a potential entry point but, again, you need to evaluate the wider context. Still, this is one screen to help you find that buy-the-dip moment.
2 - Compression Break
TTM Squeeze: Histogram Crossed Above 0
Tightly-wound movements signal coiled tension. Volatility contracts until the market finds a catalyst. Once that happens, volatility expansion can take the form of a sudden and strong breakout. You’ll notice that this one’s a single filter. The aim is to catch the moment that compression fires in a bullish direction. This combination will catch movement that has already passed, so use your judgment to figure out what’s tradable and what’s not.
3 - Momentum Cooldown
50-Day SMA: Price Above + RSI(14) between 30 and 50
I have to begin with a caveat. This one’s strange, and perhaps a bit risky, because the RSI is clearly in a bearish range, with momentum weakening. Still, price is above the 50-Day SMA. It can weaken further, or it can bounce. Check the chart to see what’s going on. Is bearish sentiment over-extended? Is there a clear reason why the stock’s momentum is dwindling? Sometimes, bearish readings can signal bullish opportunities. To capture those, you need to grasp the big picture. You also have to be agile in case your contrarian approach doesn’t pan out.
4 - High-Conviction Gap
Bullish Gap Up Over 3% + Relative Volume 2x Average Volume Gainers
This combination tends to yield results on rare occasions. It just doesn’t happen often. When it does, it’s worth paying attention. Some gaps will fill while others will continue in their initial direction. Though you can’t predict with 100% certainty which is which, you can screen for one factor that often separates a tradable gap from a fakeout: participation. Pairing the gap with unusually high relative volume can filter out the lower-conviction gaps. The aim is to spot the ones that are likely backed by institutional buying.
5 - MACD Cross
MACD(12,26,9): Crossed Above Signal + SCTR Value above 60
When the MACD line crosses above its signal line, it marks a shift in short-term momentum. By layering that cross with a SCTR strength filter, it increases your odds of spotting stocks exhibiting real technical strength. The big limitation here is that you can’t pair the signal-line cross with a zero-line filter in the same screen. That means the combo will fire whether the cross happens deep in bearish territory or already well above the zero line. This is where your judgment will come in, as a cross below and above the zero line are two different stages entirely.
6 - Bollinger Band Squeeze
Price Performance Up +20% Past 1 Month + Bollinger Bands: Width < 5 (Tight Squeeze)
Another rare one. In this combo, you’re looking for a stock that’s up sharply over the past month but is now trading in a tight, coiled range. The aim is to capture a strong continuation breakout following a period of narrow contraction. Again, this combo uses very specific parameters and will not yield results often. Tweak the Price Performance timeframe to get different results.
7 - The Cloud Confirmation
Ichimoku Cloud: Above Cloud + SCTR Value above 80
When a stock is trading above the Ichimoku Cloud, it suggests that the trend structure likely favors the bulls. A high SCTR reading in addition to that adds a layer of confirmation that the stock is also outperforming broader peers as well. Still, you have to pay attention to the price action to see, more specifically, what price is doing despite being above the cloud.
8 - Support Bounce and Reversal
Relative Volume 2x Average Volume Gainers + Bollinger Bands: Price Crossed Above Lower Band + Single Candle: Hammer
A sharp volume spike near a support level can signal capitulation or accumulation. Adding a bullish reversal candle and a BB band cross narrows your selection to stocks bouncing with decent volume. Note that this is perhaps the rarest of combinations to yield results.
9 - Volume-Backed New Highs
1-Month High/Low: New High Today + Relative Volume 1.5x Average Volume Gainers
New highs on flimsy volume are strong candidates for shorts looking to fade a bullish move fueled by low conviction. On the other hand, a new high with higher-than-average relative volume behind it suggests fresh buyers are actually stepping in at the highs. Participation is relatively strong, signaling the possibility of follow-through.
Still, even a follow-through may not have a strong case for holding it long-term. In this combo, you’re looking for a strong, short-term upswing. This works for swing traders but, if you’re planning to hold it beyond that point, you’ll need more criteria to justify that decision.
10 - The SAR Flip
Parabolic SAR: Flipped Bullish + 50-Day SMA: Price Above
Something to know upfront: J. Welles Wilder Jr. designed the Parabolic SAR primarily as a trailing stop, not an entry trigger. It was designed to help you protect profits in a trending market. Using the bullish flip as an entry point is a secondary use, but it can whipsaw in a choppy market. Requiring the stock above its 50-day SMA keeps you on the right side of the market, but you’ll have to watch the price action to avoid getting stuck in a sideways market. If you want to use the bullish flip as an entry signal, do so with caution and look closely at the price action to see if there are other indications signaling an entry.
And That’s a Wrap
My goal here was to creatively construct some examples using a few classic swing trading scenarios or conditions. These ten are just a starting point. Hopefully they get you going. Your job is to experiment with the Screener to come up with your own combos.