Financials Keep Surging: Why XLF’s 11-Week Winning Streak Has Further to Run

Key Takeaways
- The Financials sector is on an 11-week heater, with banks, insurers, and asset managers all contributing to the group’s broad-based rally.
- Technicals remain bullish, with a breakout above the ETF's January high and summertime relative strength.
- Seasonality may bring volatility, but the broader backdrop looks constructive following a fundamental boost from NVIDIA CEO Jensen Huang this week.
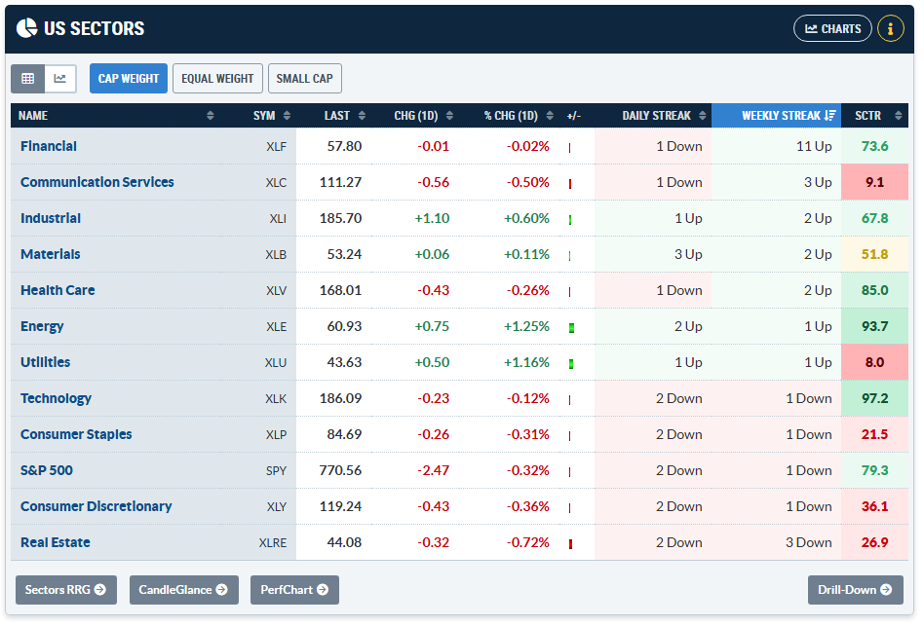
It’s the dog days of summer, and Financials is on an all-time hot streak. The sector is gunning for its 11th straight up week, which would be a record for the bank-heavy group. Sure, names like JPMorgan Chase (JPM) and Bank of America (BAC) have never looked better, backed by impressive Q2 earnings, but it really has been as close to an all-skate as you can get. Insurance stocks soared in June; Berkshire Hathaway (BRK.A) has quietly tagged 52-week highs; and asset managers caught major bids in recent days.
The Next Catalyst: Jensen Huang
The big news: Earlier this week, NVIDIA (NVDA) CEO Jensen Huang convened leaders from six major Wall Street investment firms to launch an independent platform aimed at raising $500 billion in third-party capital. The so-called godfather of AI envisions a new asset class, akin to mortgage-backed securities, to better fund massive AI buildouts. Risk would shift away from NVIDIA’s balance sheet and to investors seeking exposure to semiconductors, specifically.
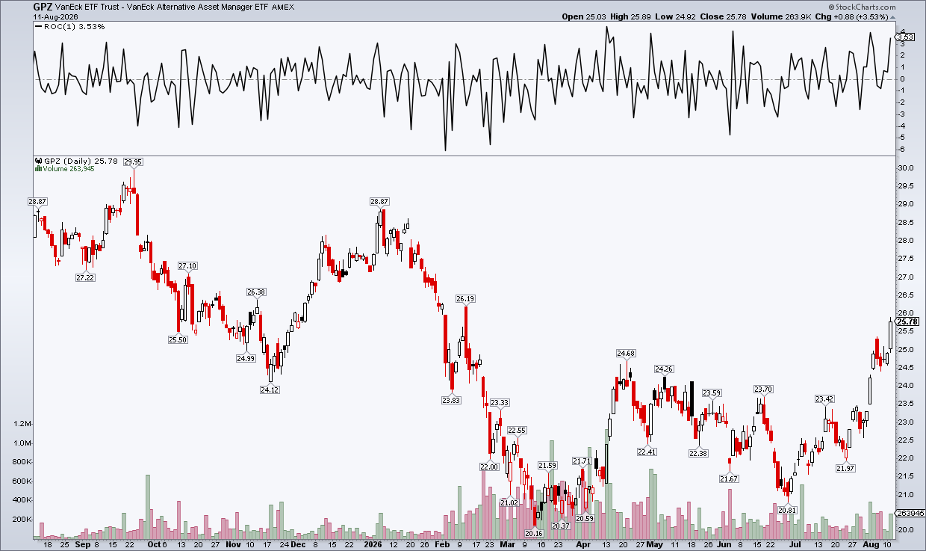
That was all music to the ears of companies like KKR (KKR), Apollo (APO), Blackstone (BX), and Carlyle (CG), among others. A little-known ETF, the VanEck Alternative Asset Manager Fund (GPZ), broke to six-month highs, up 3.5% in the following session. That was a critical climb, as the cadre of asset custody stocks had long struggled amid the software crunch and fears of contagion and cockroaches in the private credit niche.
Upbeat Price Action at Every Turn, But Are Conditions Too Frothy?
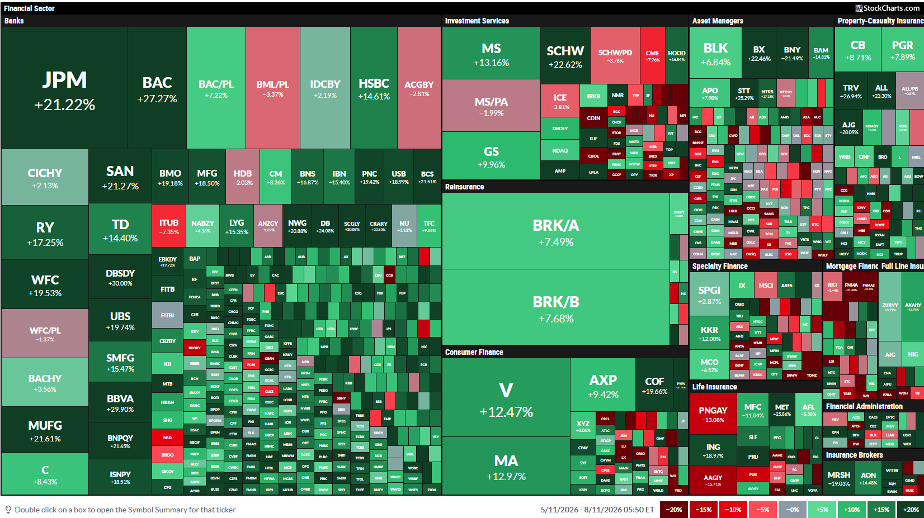
Those concerns, for now, are quelled. While KKR, BX, and the like are still 20% or more from their respective 52-week highs, throw a dart elsewhere on the Financials heat map and you’ll likely land on big green.
But up 11 weeks in a row... is that too far, too fast? Maybe. Let’s lean on the charts and technical data rather than guesswork. And there’s no better place to start than with the Financials Select Sector SPDR ETF (XLF).
XLF: Record High, Impressive Momentum, Golden Cross
Notice in the chart below that the fund is doing most of the right things. Up 20% from the March 30 low, XLF has tallied one record high after another while tech and chip stocks remain below their May and June peaks. The defining feature, in my view, is a bullish upside breakout in just the last month. The rally above the January high of $56.51 triggered a measured-move upside price target to near $66, based on the $9 depth of the Q1 decline. I assert that more gains are on the horizon, despite sketchy seasonality on tap.
Also, look at the long-term 200-day moving average. It’s on the rise, suggesting that the bulls control the primary trend. A bullish golden cross pattern occurred just ahead of bank earnings last month, while the RSI momentum oscillator at the top of the SharpChart ranges in a bullish zone from 60 to 80. In short, the bulls have ceded zero ground this summer.
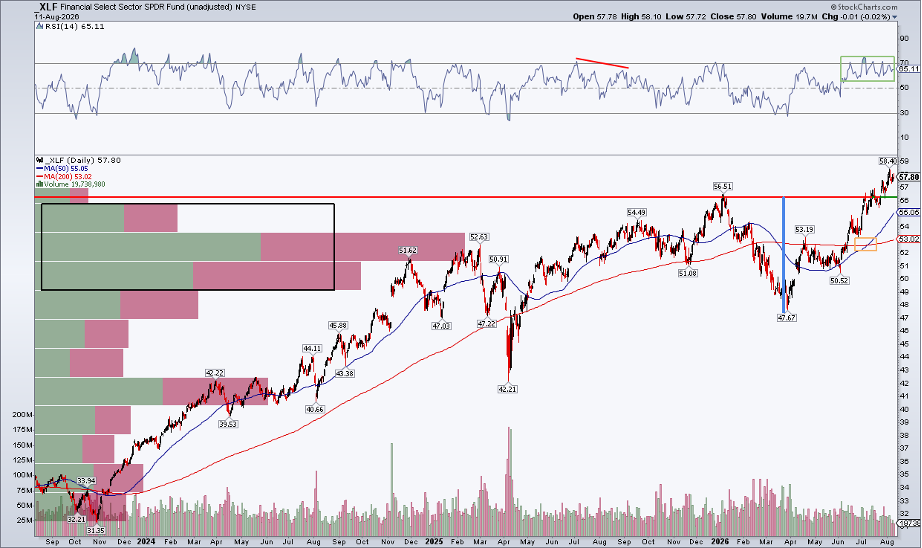
Today, with a high amount of volume-by-price starting in the mid-$50s, there should be ample support if we see one of those late-Q3/early-Q4 retreats. The one slight against XLF’s chart is that we haven’t seen a ton of volume during the July-August breakout. But it’s summer, so perhaps that’s to be expected.
Don’t Fear the Fall
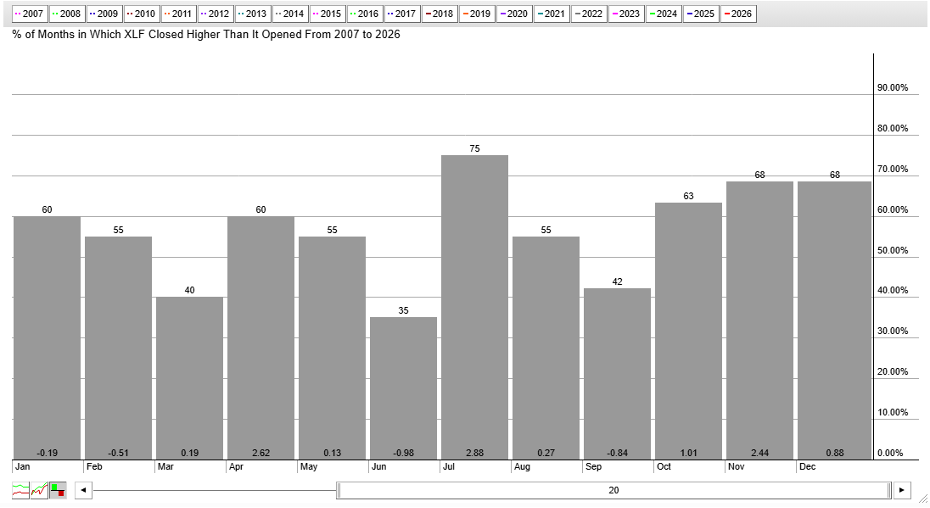
I mentioned seasonality earlier. The Financials sector is notorious for autumn volatility. Once again, the data is less scary than the narrative. Since 2007, August has produced a small gain, up 27 basis points, on average. September is admittedly a poor month, with a mean loss of 84 basis points and up just 42% of the time, but XLF weathered June (the worst of the 12 months) fine. Big gains have often come about in Q4.
The AI Boom is a Banker’s Friend
At the macro level, lenders stand to benefit from higher global interest rates and intense borrowing demand, particularly from the AI hyperscalers. Both debt and equity financing charts are up and to the right, and Wall Street bankers are there with open briefcases to extend credit and promote secondaries.
RRG: XLF Officially Leads
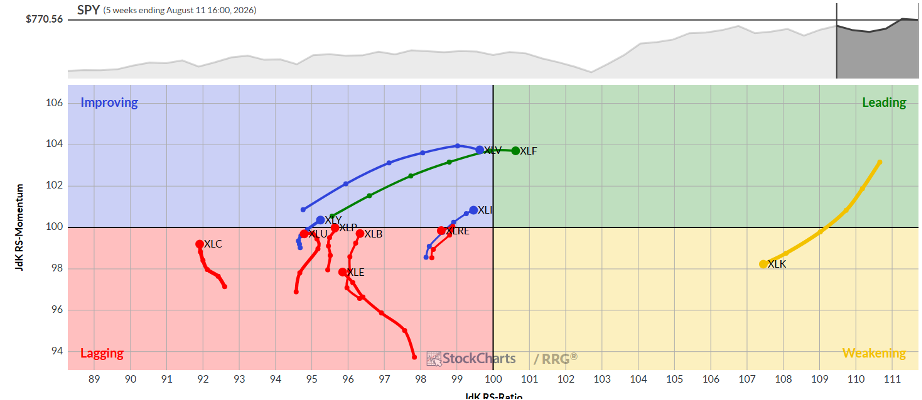
From a relative strength perspective, XLF also appears strong. My rule is to defer to Julius de Kempenaer for RRG analysis, but the current look is straightforward. XLF is now the lone S&P 500 sector ETF in the green “Leading” box. Only recently did it slide to the right on the one-year weekly view benchmarked to the S&P 500 ETF (SPY). The Relative Rotation Graph confirms what we see on the price chart and in macro headlines.
The Bottom Line
Financials are firing on all cylinders. That’s usually good news for the broader market, as it indicates a healthy risk appetite from credit to IPOs to global growth. This week’s jump in asset manager stocks lifted an embattled industry, only further bolstering XLF’s summertime surge. Trends persist until there are definitive exhaustion or reversal signs, and those are nowhere to be found yet in Financials.
Disclaimer: This blog is for educational purposes only and should not be construed as financial advice. The ideas and strategies should never be used without first assessing your own personal and financial situation, or without consulting a financial professional.