Industrials SPDR Pulls Back within Uptrend - Is this a Threat or an Opportunity?
Key Takeaways
- A bull market is currently present in the S&P 500.
- As established with a look at PPO, the Industrials sector has established a long-term uptrend.
- With the help of chart patterns, traders can find good tradable setups within the broader uptrend.
Led by weakness in the Aerospace & Defense industry, the Industrials SPDR took a hit in the second half of August. Despite this, however, XLI is in a long-term trend and setting up after a short-term pullback, as is the Aerospace & Defense ETF.
Pullbacks within uptrends are opportunities as long as two conditions are met. First, the broad market environment must be bullish. Second, the ETF must be in a long-term uptrend. Once these conditions are met, chartists can look for short-term bullish continuation patterns and oversold conditions to find opportunities.
A Bull Market for the S&P 500
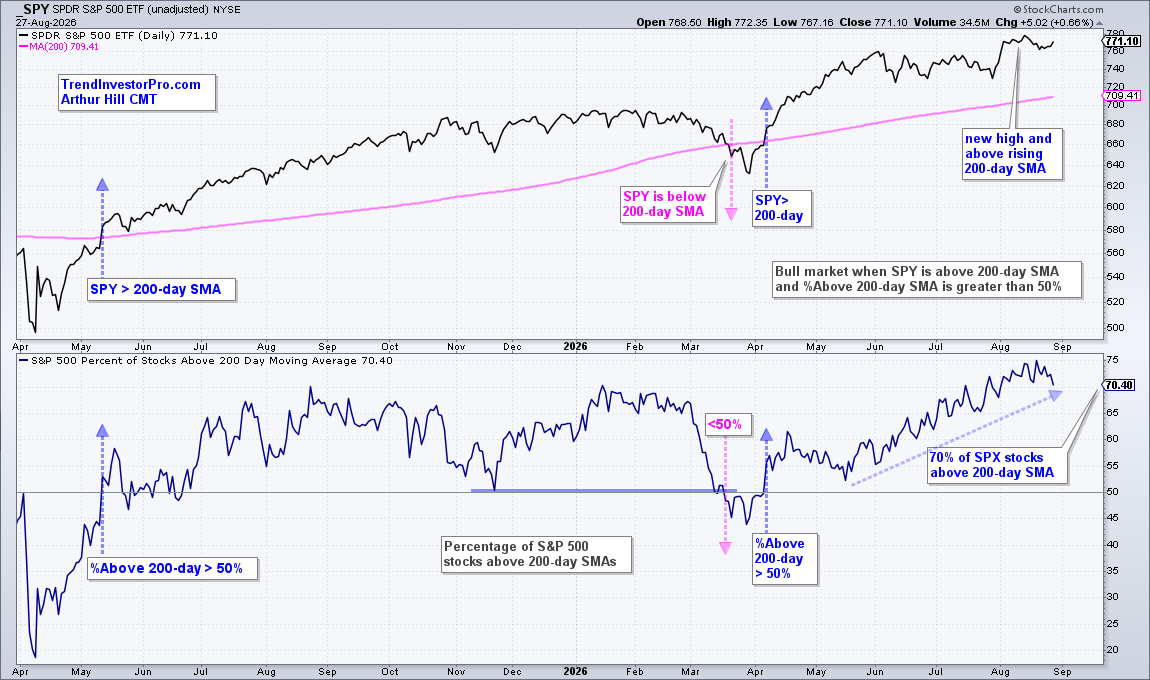
The first chart shows SPY with the 200-day SMA and SPX %Above 200-day SMA ($SPXA200R). In general, a bull market is present when SPY is above the 200-day SMA and more than 50% of its components are above their 200-day SMAs. These two have been in bull mode since early April. Most recently, SPY hit a new high in August, and some 70% of S&P 500 stocks are above their 200-day SMAs. This means the vast majority of stocks are in long-term uptrends. The Market Regime models at TrendInvestorPro have been bullish since June-July 2025.
Establishing the Long-term Trend with the PPO
Moving averages are notorious for lag and whipsaws, but they can still catch some big trends. The chart below shows XLI with the 200-day EMA. Notice how XLI crossed the 200-day EMA four times in March 2025 before making a definitive cross in early April 2025 (blue shading). XLI also closed below the 200-day EMA on March 30th and moved right back above on March 31st (1-day whipsaw).
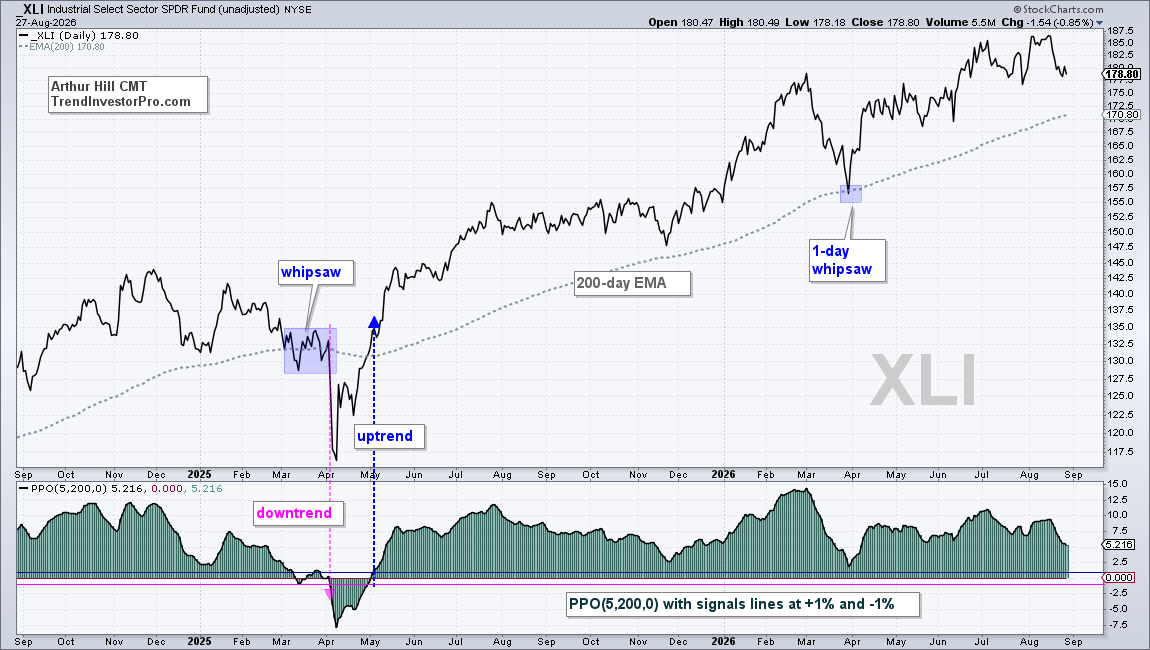
Chartists can reduce whispaws by smoothing the close with a 5-day EMA and adding a signal threshold. The indicator window shows the PPO (5,200,0), which measures the percentage difference between the 5- and 200-day EMAs. An uptrend signals with a move above +1% (blue dashed arrow), while a downtrend signals with a move below -1% (pink dashed arrow). XLI crossed its 200-day EMA eight times on this chart, but the PPO only triggered two signals: a downtrend (April 3, 2025) and uptrend (May 5, 2025). The May 2025 signal has been active for well over a year. Not bad.
Recent Reports and Videos at TrendInvestorPro
- Aerospace/Defense Leads XLI Pullback within Uptrends – 3 Stock Setups
- Homebuilder ETFs Consolidate After Outsized Moves – 3 Stock Setup
- Nvidia, Semis and AI-adjacent ETFs Hold the Key for Tech and QQQ
Click here to take a trial and gain full access.
Finding Tradable Setups within the Uptrend
Once the long-term uptrend is established, chartists can look for opportunities using bullish continuation patterns, such as triangles/pennants, falling channels/flags, and falling wedges. The chart below shows at least six such patterns over the last 15 months. These patterns represent a pause or correction within the uptrend. Subsequent breakouts signal an end to the pause and a resumption of the uptrend.
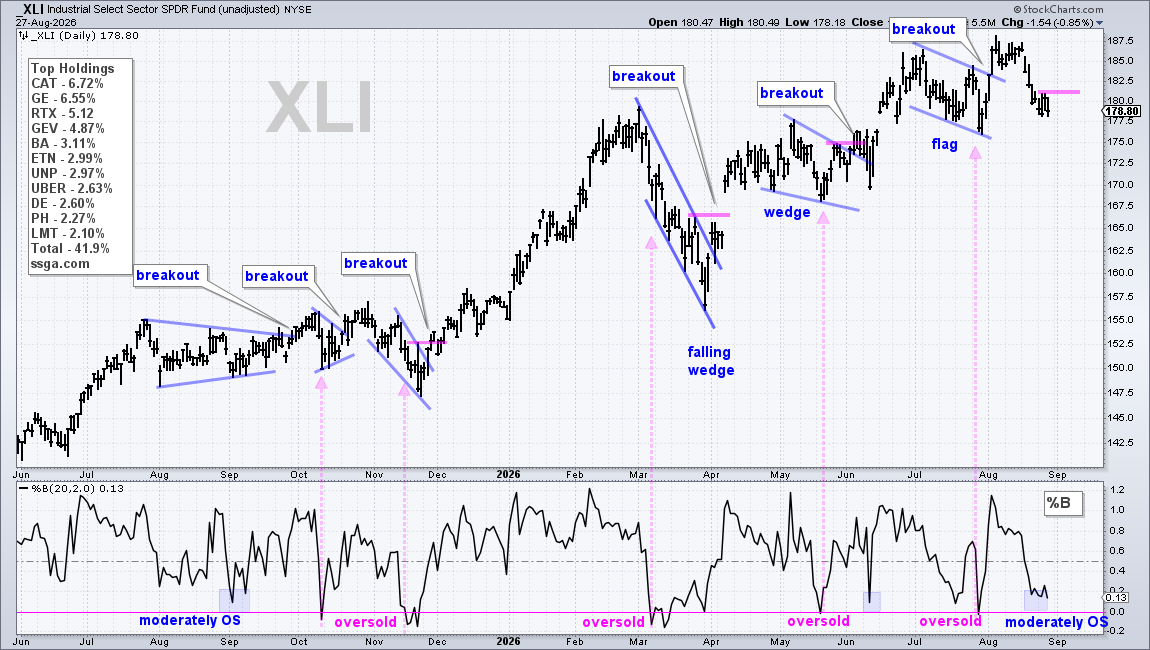
Not all breakouts are clean, and some fail, but the odds remain bullish as long as the ETF is in a long-term uptrend and the market environment is bullish.
The indicator window show %B (20,2), which moves below zero when the close is below the lower Bollinger Band (20,2). A move below zero signals a short-term oversold condition that alerts traders to a pullback or consolidation on the chart (pink arrow lines). There are degrees of oversold as well; for example, a move into the 0-.20 area acts as a moderately oversold condition (blue shading). Notice that %B became moderately oversold after the recent pullback. A pullback within an uptrend is an opportunity and a break above this week's high would be bullish.
The Aerospace & Defense ETF (ITA) represents the biggest industry group in the Industrials sector. TrendInvestorPro featured this ETF and three defense stocks because they are in long-term uptrends and setting up bullish. Click here to take a trial and get immediate access.