Using Seasonality to Enhance Your Trading Results
We see history repeat itself over and over again in the U.S. stock market, so it's a good idea to have a grasp on market history. Many stocks do have specific tendencies (not guarantees) during various times throughout the calendar year, so knowing when a stock has seasonal tailwinds can absolutely add to your trading success.
I have an Excel spreadsheet where I track over 1500 companies (the S&P 1500 plus stocks in the NASDAQ 100 that are not also in the S&P 500). We publish a monthly Seasonality Report for our EarningsBeats.com members to ensure that they understand what companies have shown a propensity to advance during a particular month. At the beginning of August 2026, for example, we provided a list of stocks that enjoy a history of success during August. Below is the list, along with how they've performed over the past month. (The S&P 500 is included, just to show how these stocks have performed in August 2026 vs. that benchmark.)
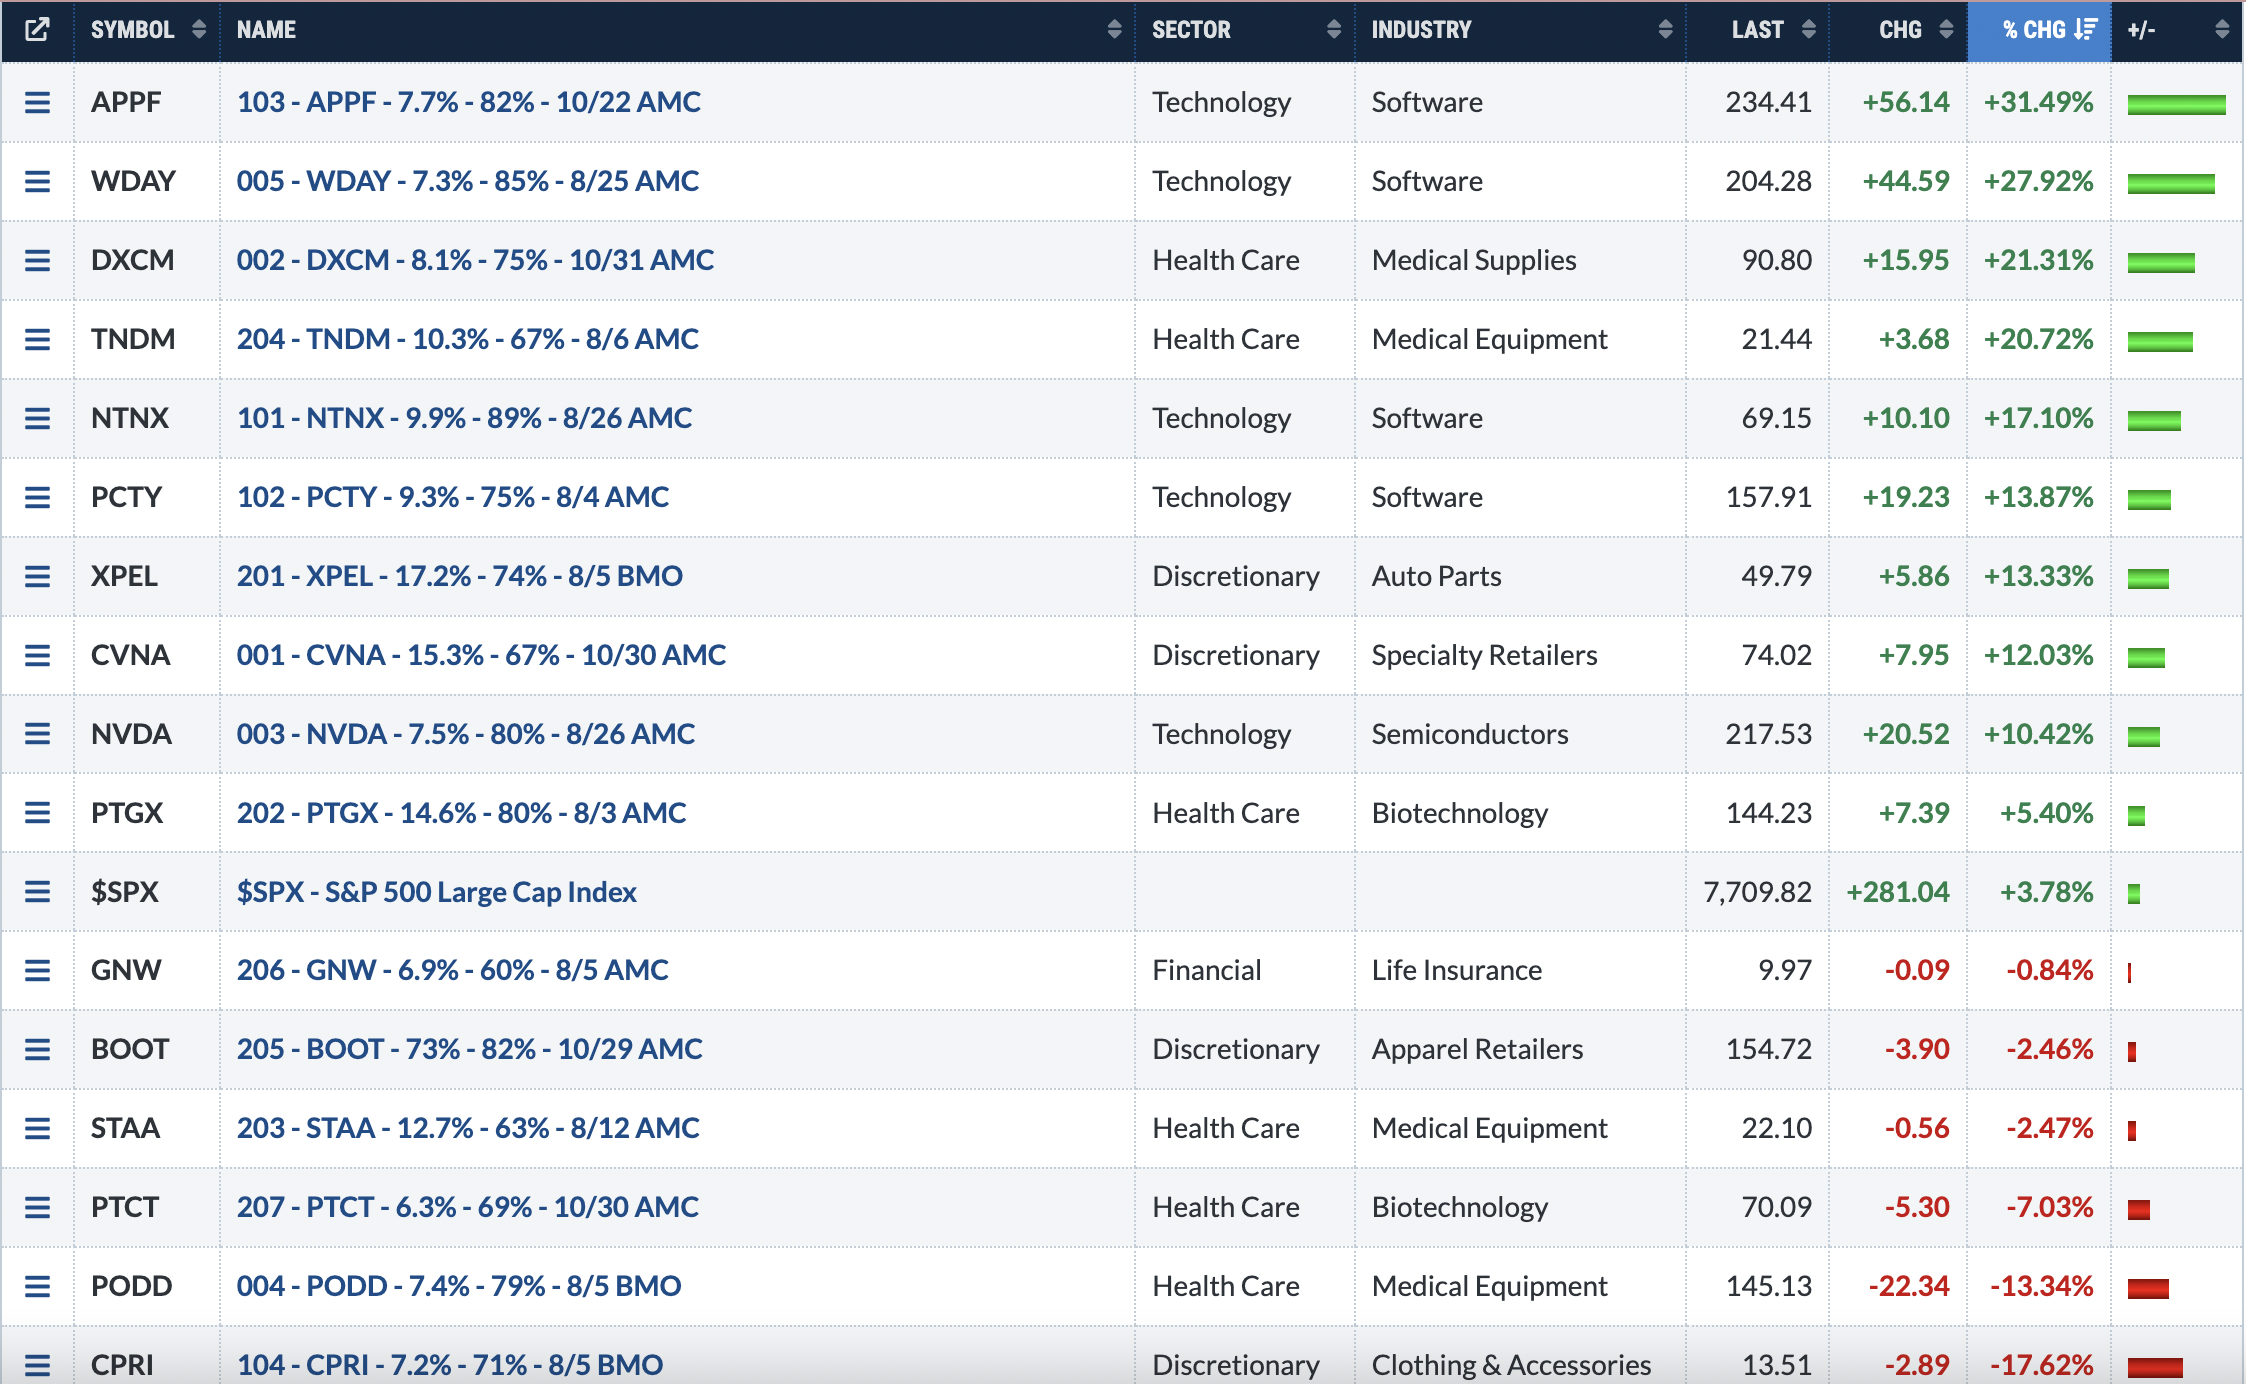
This entire ChartList is available for EB.com members to view and/or download at the time the Seasonality Report is published. Each chart is annotated with a couple key price/gap support levels.
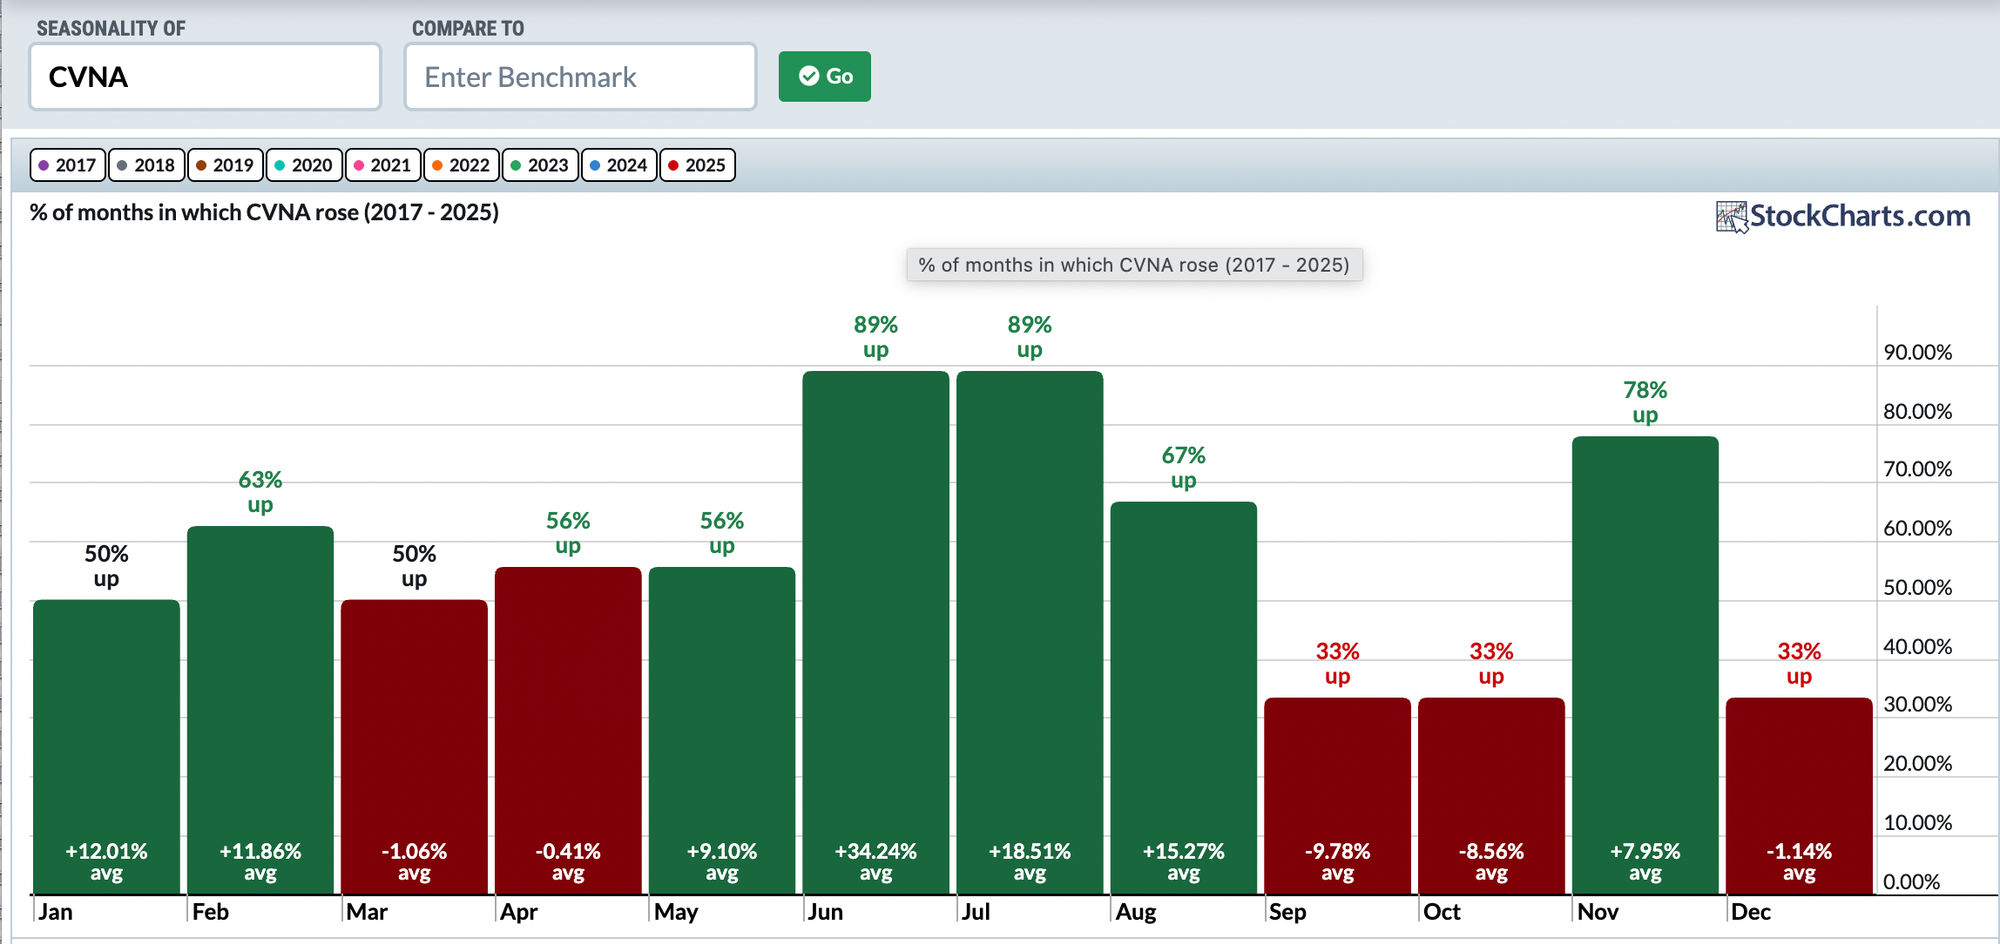
In the list above, you'll see the name showing "001 - CVNA - 15.3% - 67% - 10/30 AMC". The "001" starts with a 0 to denote that this is a large cap stock. (Numbers that begin with a 1 and 2 represent mid cap and small cap stocks, respectively.) Then comes the ticker symbol, CVNA. Following that is "15.3%". That represents the average August return on CVNA over the past 20 years. The "67%" refers to the percentage of Augusts where CVNA finished higher than it began, so roughly 2 out of every 3 Augusts, CVNA has moved higher. Then, the "10/30 AMC" represents the estimated date of CVNA's next earnings report. AMC = After Market Close. BMO = Before Market Open.
Here's an example of CVNA's Seasonality Chart, which shows where the August numbers came from:
The two worst performers during August, Insulet Corp (PODD) and Capri Holdings (CPRI), would have been very easy to discard as trade candidates in August, as they both were trading abysmally vs. their peers. I do not buy or sell any stock based solely on its seasonal history. Instead, I use seasonality as a tool to confirm or refute what I might think about the stock technically. Poor relative strength is a huge technical warning flag, in my view. Check out how both of these stocks were trading heading into August:
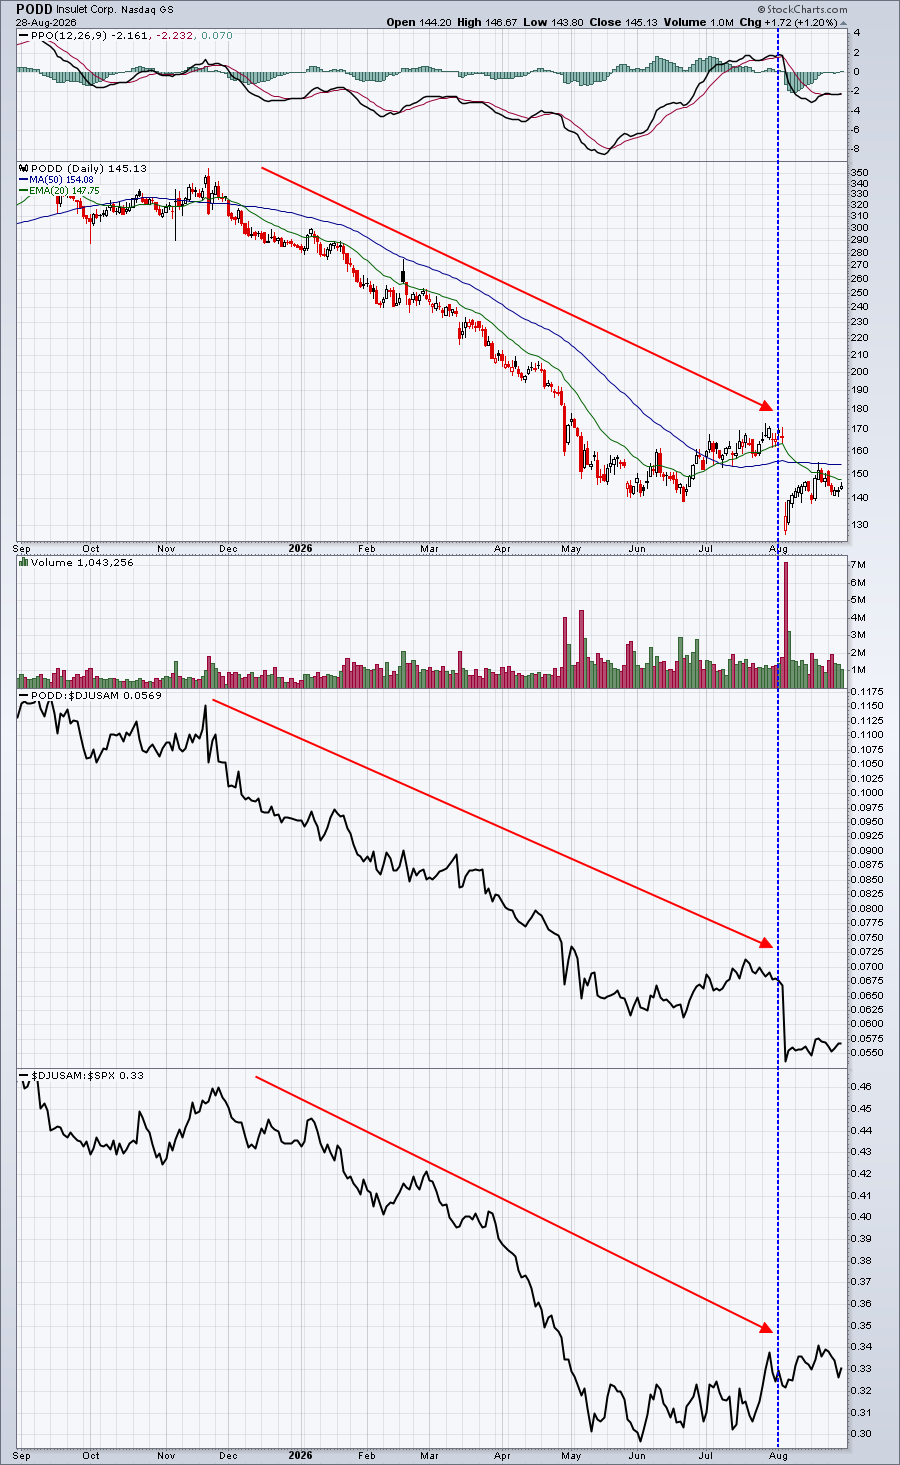
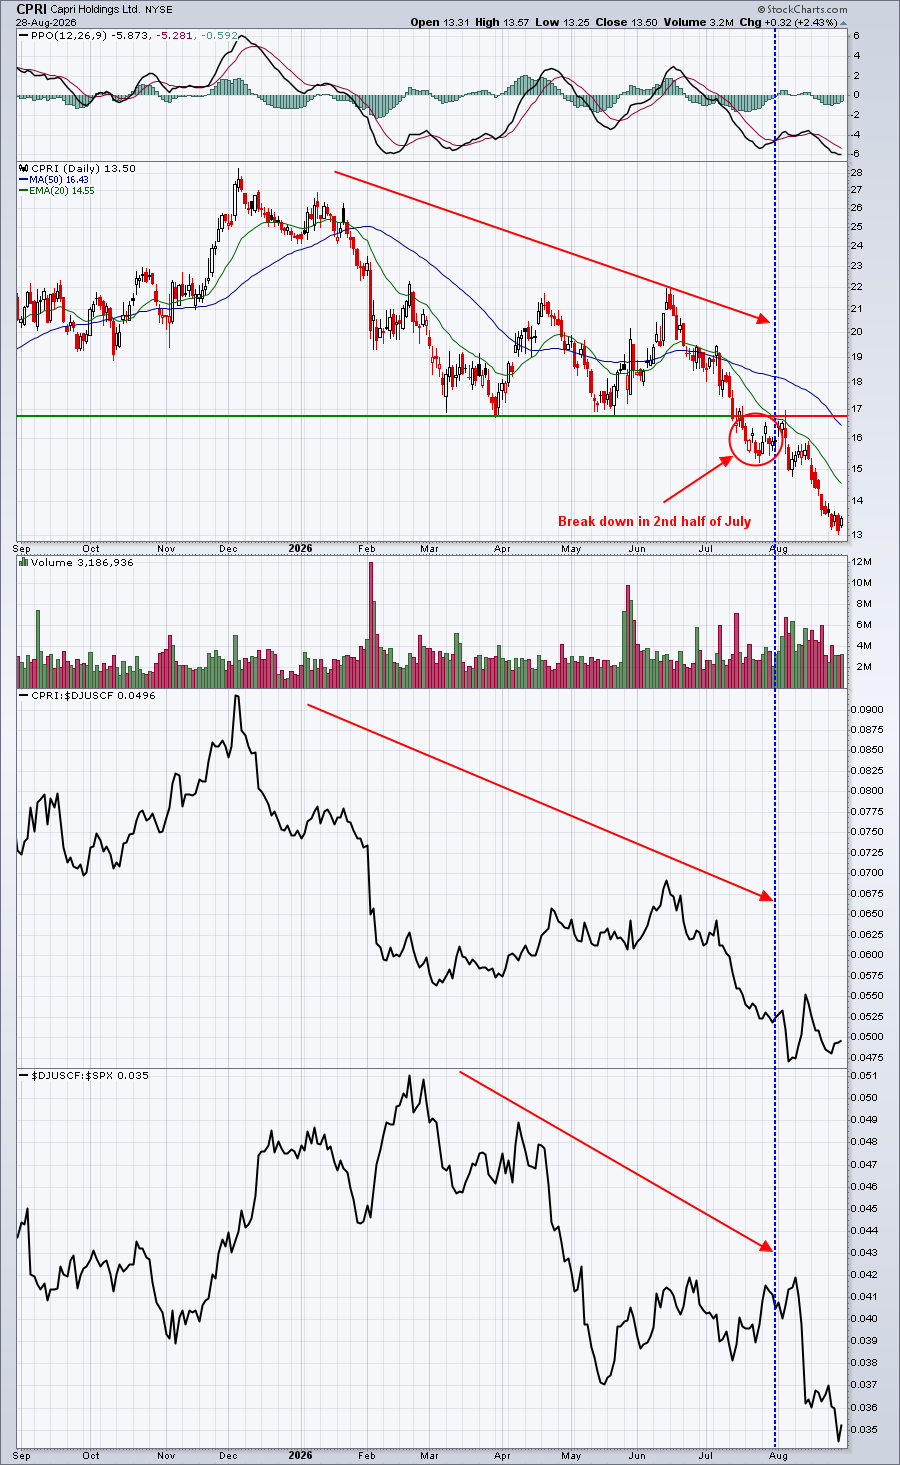
Seasonality tells us that both of these stocks have had prior August success, but, if we're looking first at the technical conditions, we'd never have pulled the trigger on these two.
Now let's take a look at the technical breakout of one of the August winners just before August started:
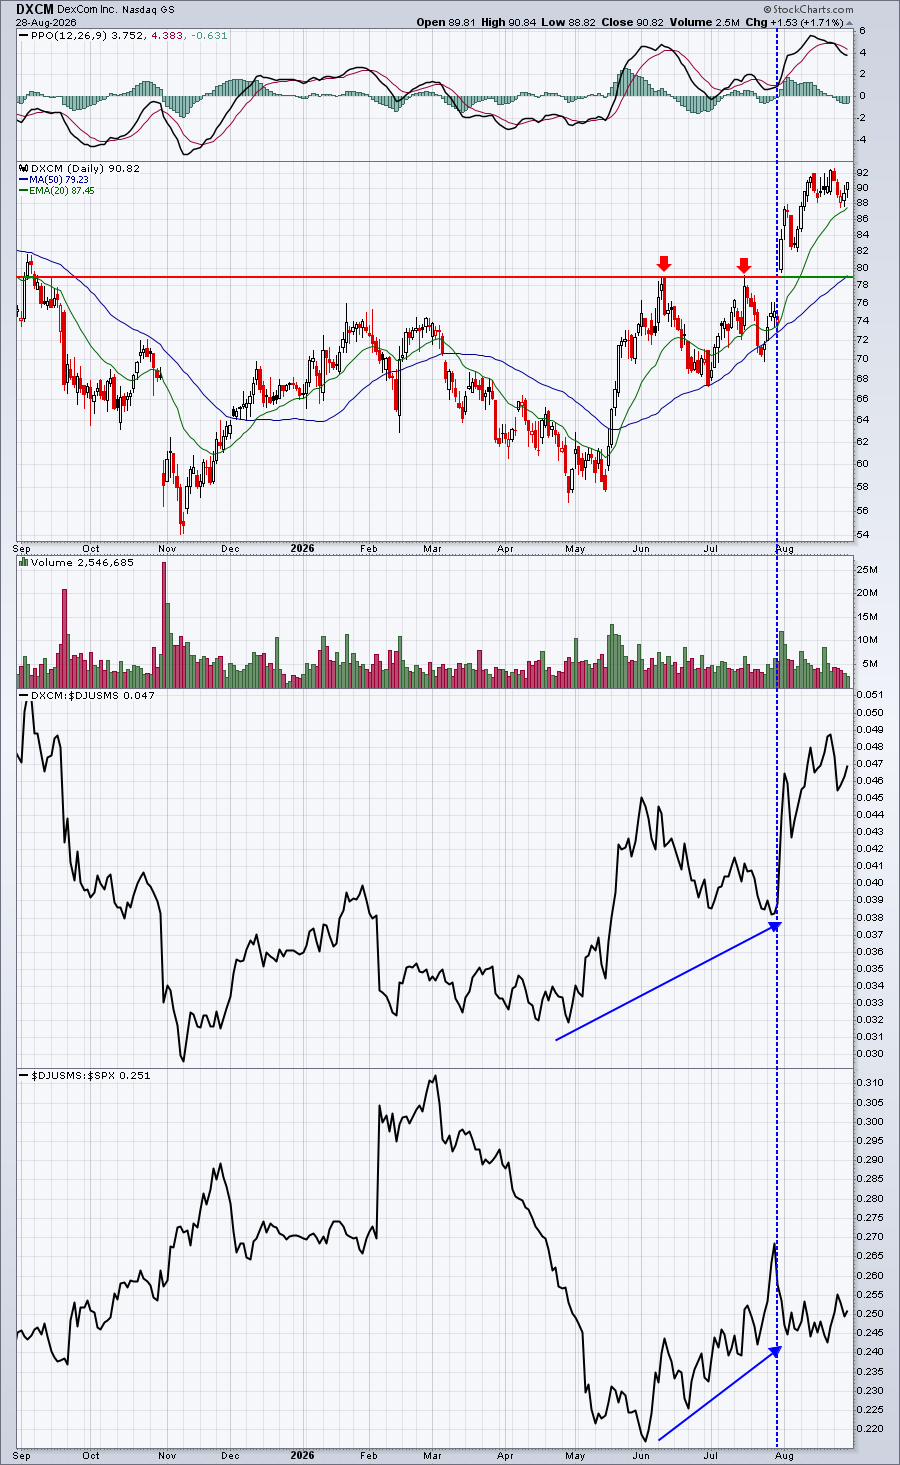
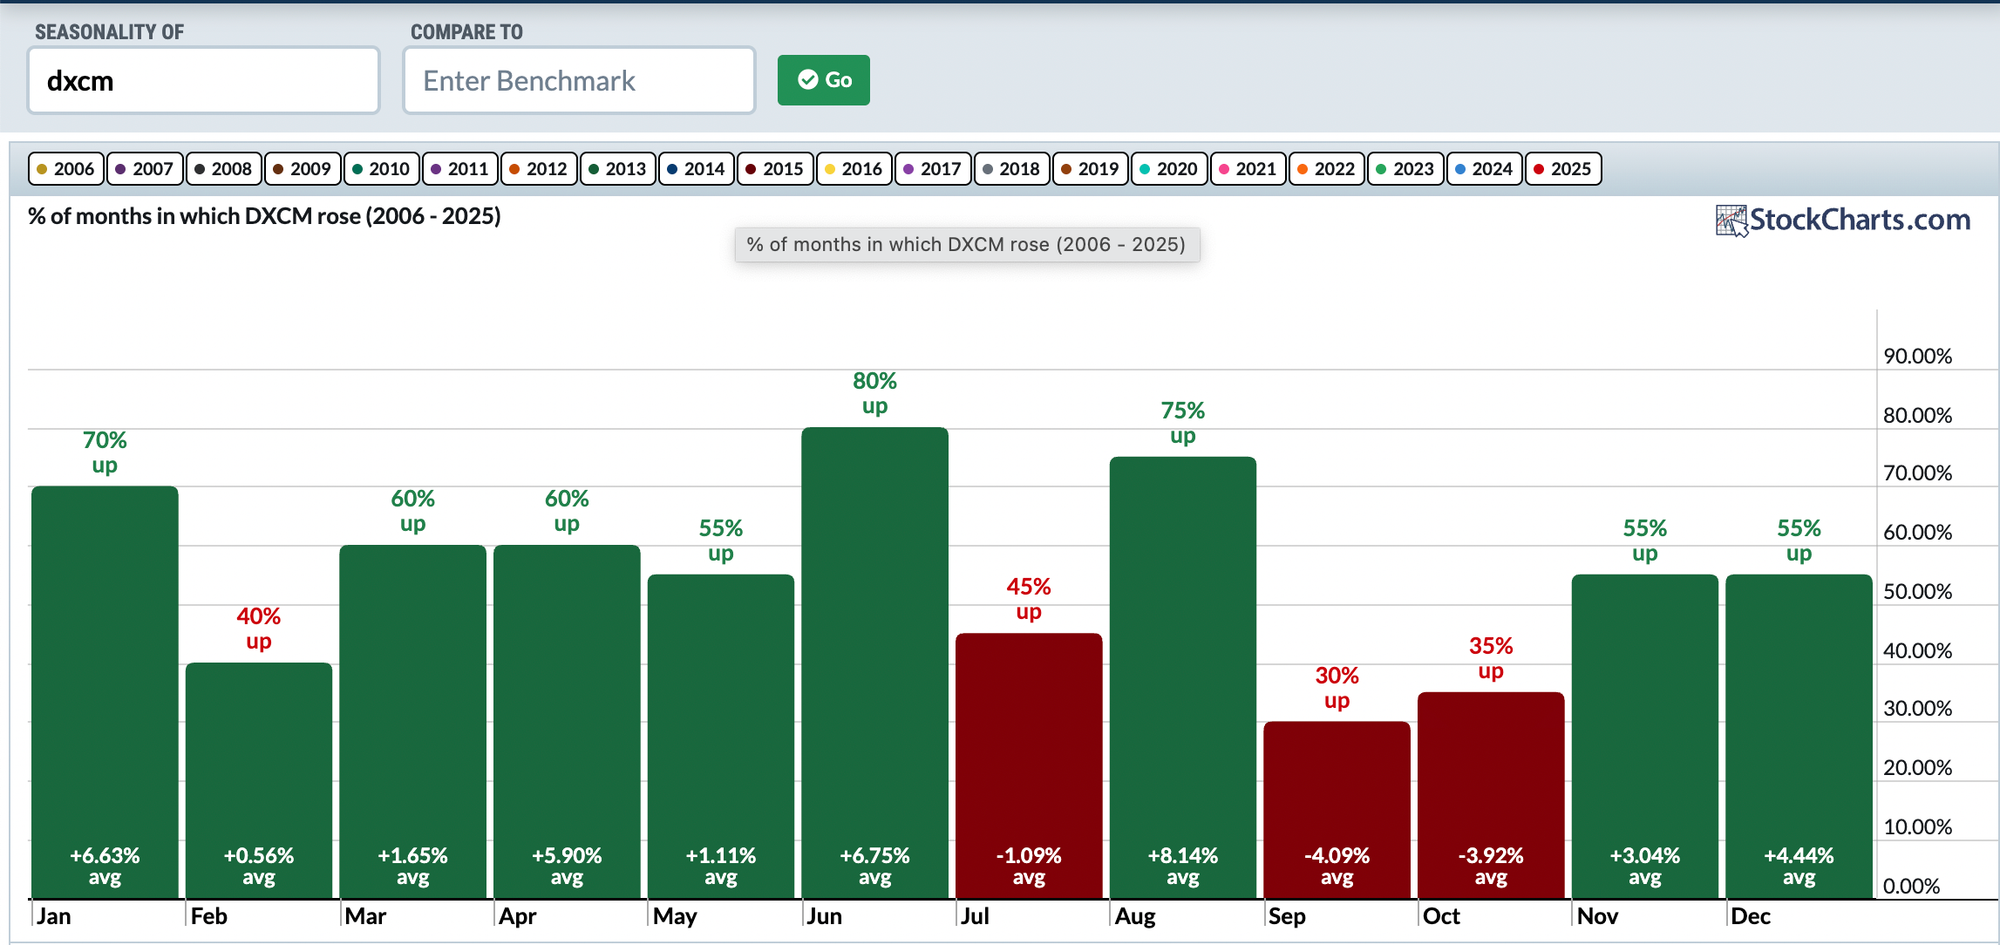
Do you see the difference? DXCM literally made a key breakout the last trading day of July. It's looking like a buy BEFORE we consider seasonality. The fact that DXCM's seasonality looked like this simply added to the bullishness of this trade:
Special One-Time Offer
We plan to send out our September Seasonality Report to everyone on our FREE EB Digest newsletter this week just as a thank you for subscribing. To claim your copy of our September Seasonality Report, simply CLICK HERE and provide your name and email address!
Happy trading!
Tom