One Bond Market Chart Every Trader Should Watch in the Second Half

Key Takeaways
- Credit spreads have begun to widen modestly, offering an early warning sign that equity charts alone may not reveal.
- High-yield and investment-grade bond spreads could become critical market indicators as AI-driven capital raising accelerates.
- With earnings season approaching, traders should keep one eye on stocks and the other on the corporate bond market.
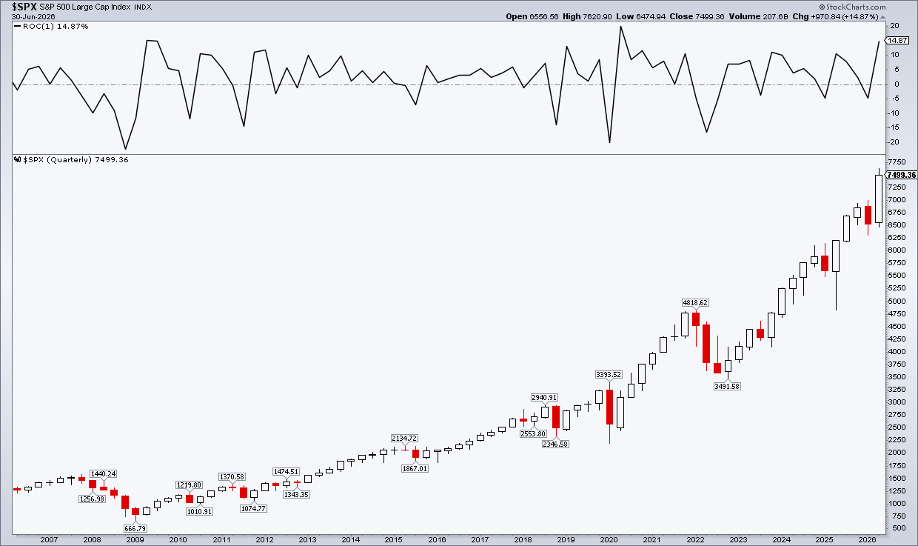
The S&P 500 scored some solid June garbage points on Monday and Tuesday. To finish the month, US large caps advanced 2.0%, rallying 205 points off last Friday’s low. Equities enter the second half just muddling around, though.
The bulls have not been able to put in a clean strike for several weeks (the first half’s closing print was almost unchanged from May 14’s settle). But the Dow 30, MidCap 400, SmallCap 600, and Russell 2000 continue venturing higher into uncharted territory.
Overseas, the Vanguard FTSE All-World ex-US ETF (VEU) returned 12.0% in Q2, its best quarter since Q4 2022, powered by the iShares MSCI Emerging Markets ETF’s (EEM) 21% surge. (EEM notched its top quarterly gain since Q2 2009.) Oil, gold, and bitcoin also suffered in June and the second quarter. Just recently, the greenback has made some noise, cracking through 100.60 resistance on the US Dollar Index ($USD).
Less talked about in all the monthly, quarterly, and first-half assessments is the bond market. The benchmark 10-year Treasury note yield fell 3.5 basis points in June. As a result, the iShares Core U.S. Aggregate Bond ETF (AGG) tallied a third straight marginal monthly gain.
At a macro level, it’s increasingly clear that Fed Chair Kevin Warsh and Treasury Secretary Scott Bessent have a wink-and-a-nod agreement to keep longer-term interest rates in check. Less than two months into his term as Fed chief, Treasury yields on the long end of the curve appear to be stabilizing. But is trouble lurking elsewhere in the fixed-income space as July gets underway?
Subtle Shifts in Credit
Every session, at market close, I review the StockCharts Market Summary page. If you scroll down to the Bond section and tap the “Fixed Income/Credit Spreads” tab, and you’ll see a clean chart on the right. Pictured below, the back half of June featured a modest but visible uptick in both high-yield and investment-grade credit spreads.
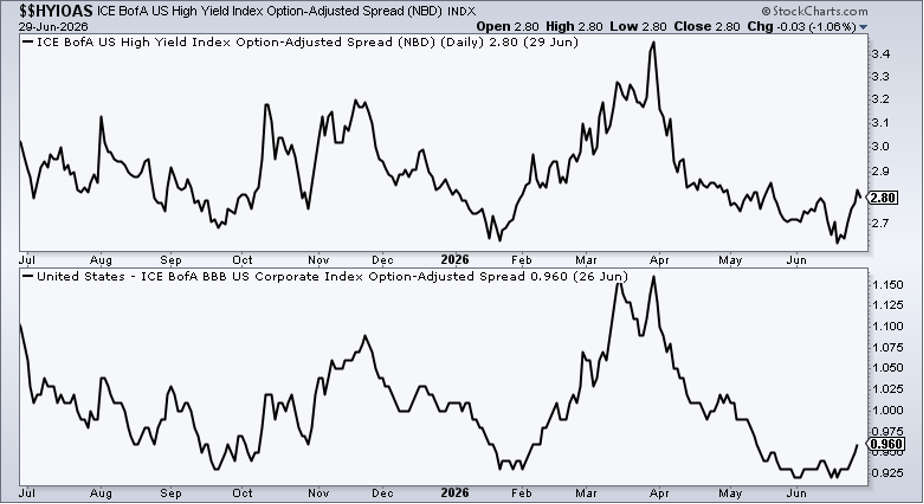
To be clear, 280 basis points on the ICE BofA US High Yield Index Option-Adjusted Spread doesn’t sound alarm bells. Likewise, 96 bps on the ICE BofA BBB US Corporate Index Option-Adjusted Spread is little cause for concern on its own. What’s worth watching, however, is a possible continued spread inflection as stocks tread higher or even rise (during what has been the most bullish month in the data over the last 20 years).
The credit market will be higher up on the risk pecking order in the second half of 2026, I assert. Given the slew of capital raises by major US companies (both debt and equity), yield spreads may offer clues that the stock market won’t fully reveal. What’s more, companies from the Information Technology sector (and other areas related to the AI buildout) command a higher share of the HY and IG markets today than they did years ago.
We’ve Heard the Warning Siren Before
Technically, look at the current backup in spreads and compare it to the late-January and early-February upticks. Recall that the S&P 500 didn’t hit a crescendo peak before the conflict in Iran. Rather, it put in a rounded top, while the iShares MSCI ACWI ETF (ACWI) was in a smooth uptrend to its February 25 high. So widening credit spreads offered a tell on the eventual global equity bullish-to-bearish reversal.
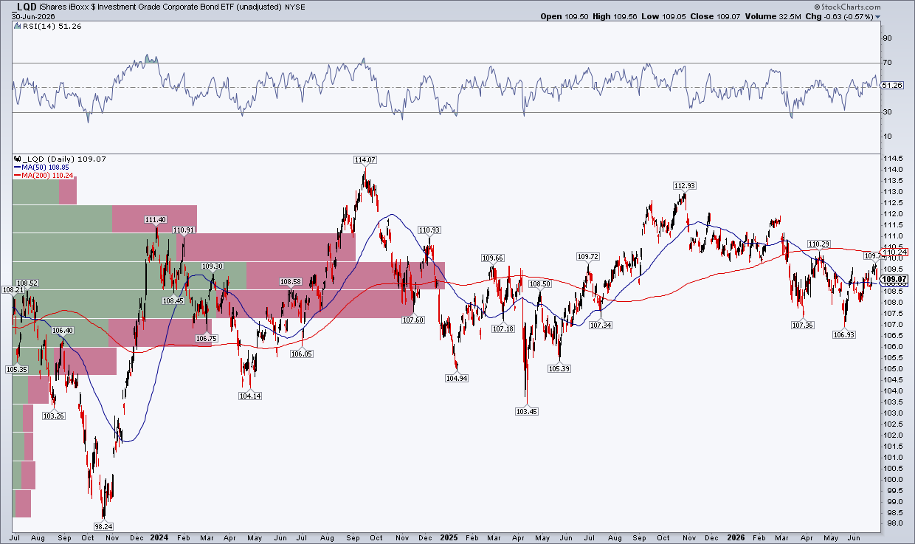
Credit spreads are all the more critical to monitor today because they are so compressed. Fundamentally, they really can’t go any lower; hence, the iShares iBoxx $ High Yield Corporate Bond ETF (HYG) is at virtually the same level as it was in late 2024. Normally, the bears could point to junk bonds not confirming new highs in the stock market. The same goes for the iShares iBoxx $ Investment Grade Corporate Bond ETF (LQD), with its price identical to late-2024 levels.
Thus, the leading indicator is more likely to be modest upswings in the yield spreads themselves.
Party On in July
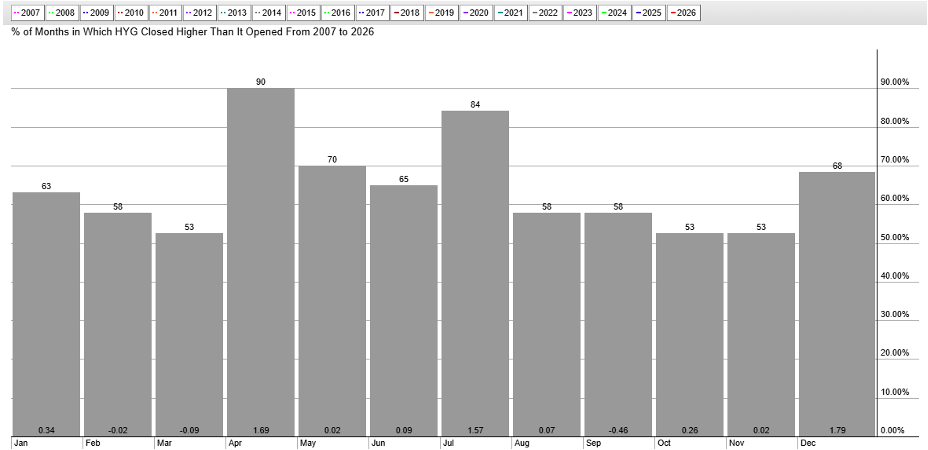
If history is any guide, the first half of July won’t feature dramatic blowouts in HY and IG spreads. Now through the start of the Q2 earnings season has been bullish for stocks and credit. But as we progress deeper into Q3 of the midterm year, increasing attention should be paid to the market’s yellow flags.
I encourage traders to review the Market Summary page, as you will be better equipped to spot nuances before they are discussed in the finance Twittersphere.
In the very near term, bond market volatility could pick up on Thursday following the June jobs report. Indications point to a healthy pace of net hiring. A beat on headline employment and average hourly earnings could rattle bonds, though good economic data tends to be positive for credit spreads. I’ll be watching and posting about the market’s response.
The Bottom Line
There are no fireworks (yet) in the corporate bond space. HY and IG credit spreads are tame, but they have crept higher as stocks have wobbled in recent weeks. Amid increasing debt and equity issuance to fund AI development, more eyeballs are likely to turn to high-yield and investment-grade spreads as the second half of 2026 unfolds. For now, small rises today don’t warrant wholesale portfolio changes.
Curious about the trends shaping today's market? Visit our Articles & Videos page nad keep your learning going.
Disclaimer: This blog is for educational purposes only and should not be construed as financial advice. The ideas and strategies should never be used without first assessing your own personal and financial situation, or without consulting a financial professional.