MEMBERS ONLY
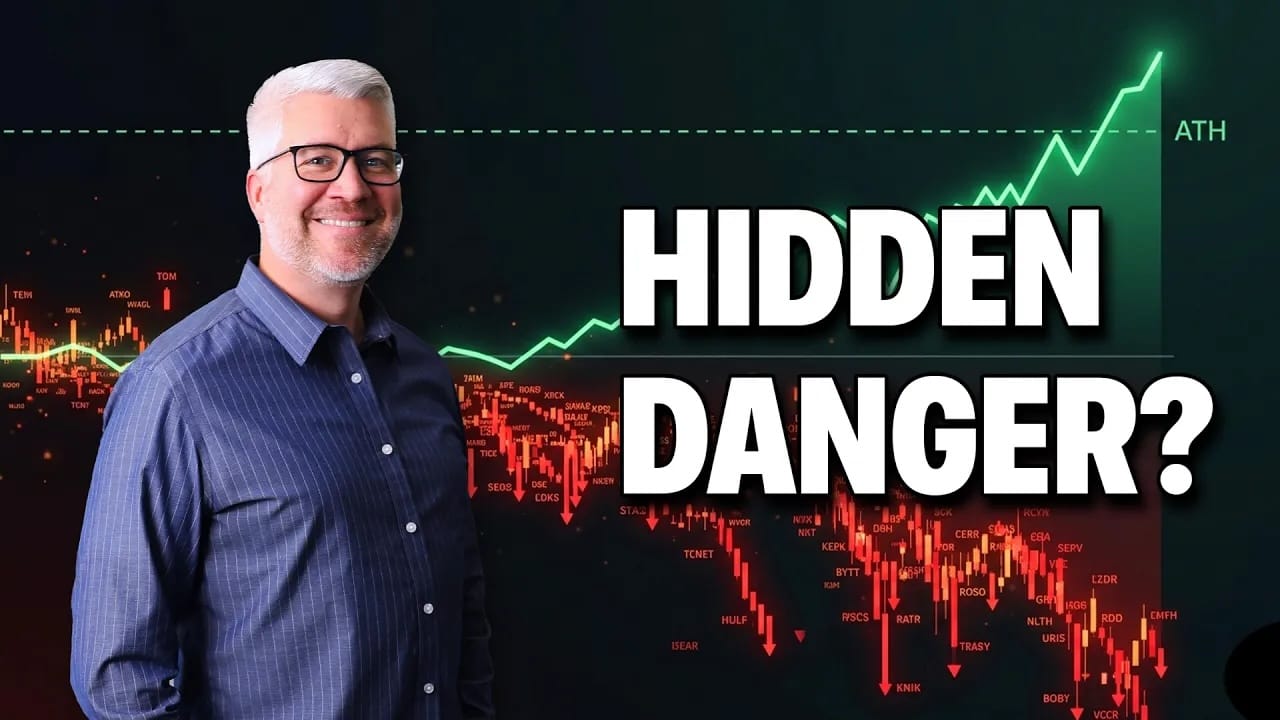
Warning Signs for Stocks: The Hindenburg Omen and Titanic Syndrome Explained

by David Keller,
President and Chief Strategist, Sierra Alpha Research
Dave Keller breaks down the Hindenburg Omen and Titanic Syndrome, two breadth indicators designed to identify conditions often seen near major market tops, and explains why recent signals deserve attention....
READ MORE
MEMBERS ONLY

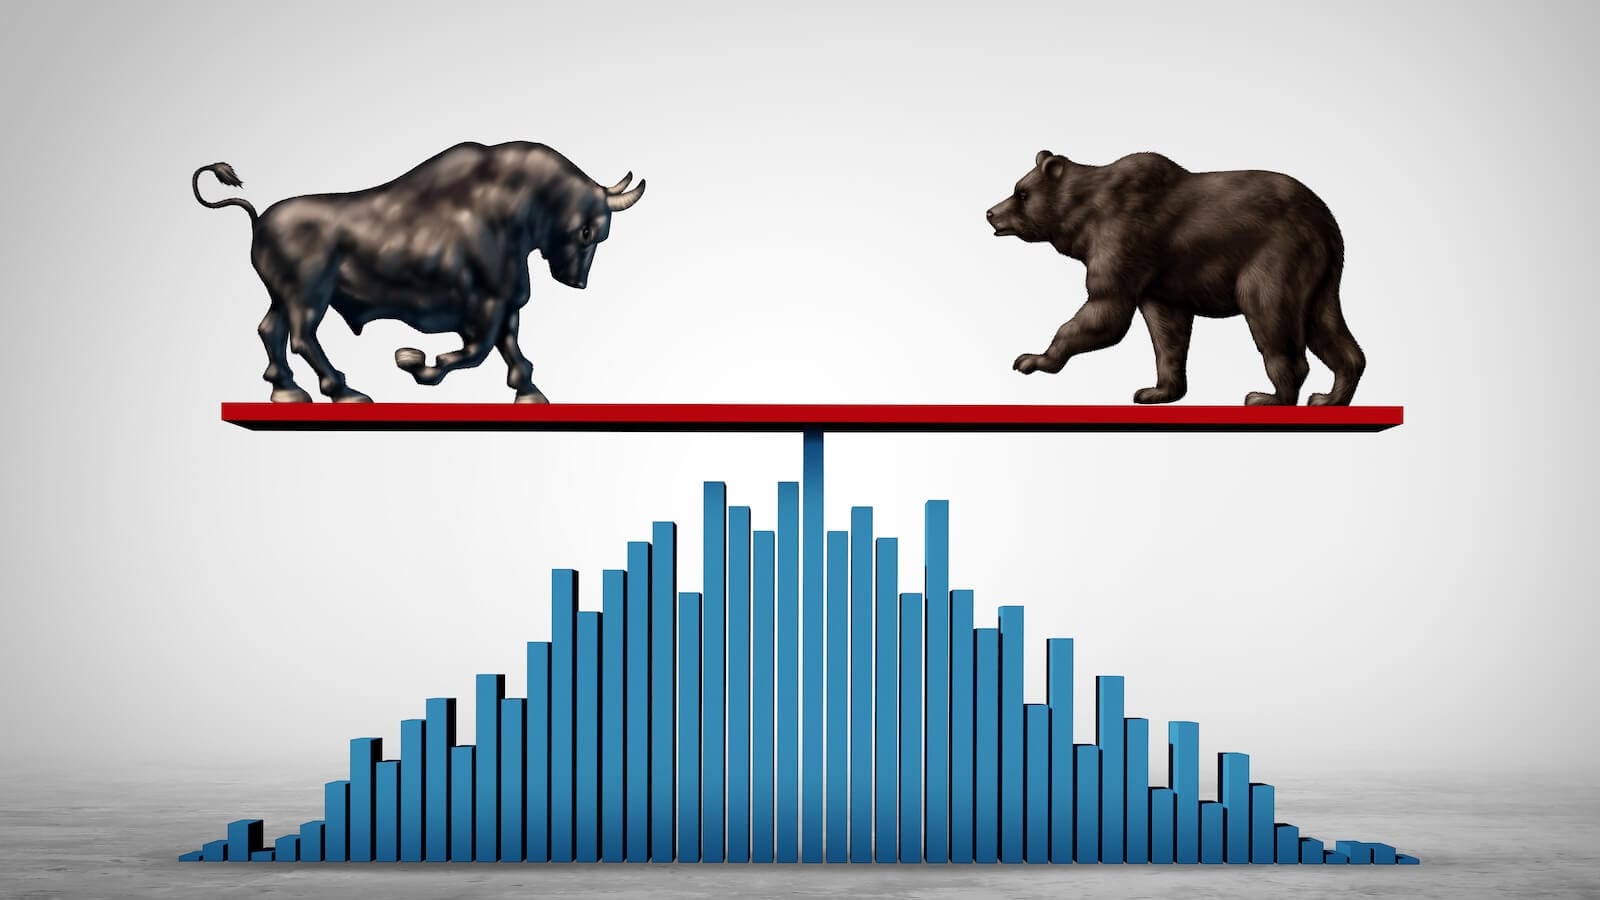
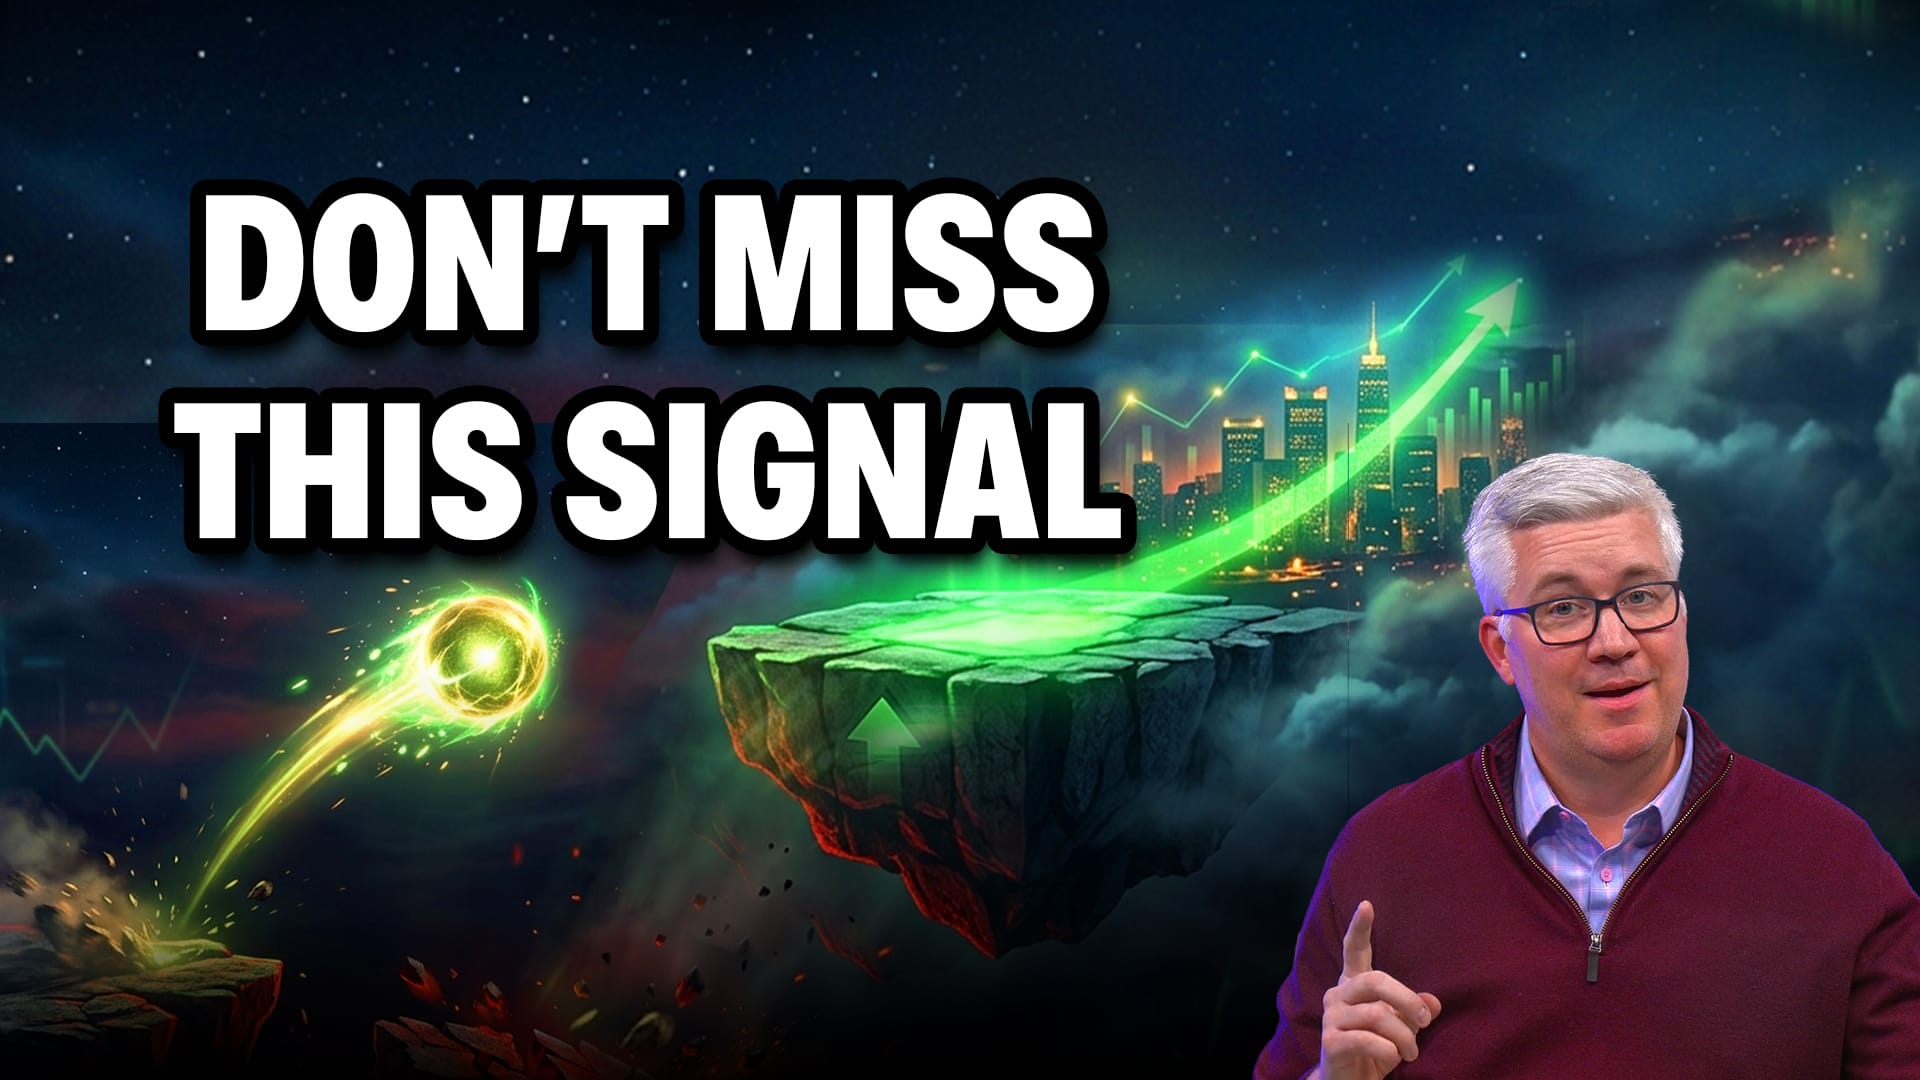
The Next Bullish Wave May Be Starting

by Larry Williams,
Veteran Investor and Author
Legendary trader Larry Williams returns with a timely update on where he believes the markets are headed next, explaining why market cycles, money flow, and seasonal patterns still point to higher stock prices in 2026....
READ MORE
MEMBERS ONLY

Week Ahead: NIFTY Stays Poised in the Coming Truncated Week

by Milan Vaishnav,
Founder and Technical Analyst, EquityResearch.asia and ChartWizard.ae
The Nifty 50 is range-bound, hovering below a key resistance zone. Milan Vaishnav analyzes the chart of the Nifty and suggests when investors should consider adding positions. He also analyzes the performance of the various sectors in the Indian stock market. ...
READ MORE
MEMBERS ONLY
Breadth Deteriorates: Is This a Threat or an Opportunity?

by Arthur Hill,
Chief Technical Strategist, TrendInvestorPro.com
Breadth in the S&P 500 and SPY is bullish, which means bullish outcomes are more likely than bearish ones. Arthur Hill analyzes market breadth in SPY and RSP and shows that the overall tone is bullish....
READ MORE
MEMBERS ONLY

StockCharts Insider: Turn Market News Into Actionable Setups

by Karl Montevirgen,
The StockCharts Insider
Before We Dive In…
Whether you trade for the short-term or long-term, the first thing you probably do every morning is check the headlines: CNBC, Bloomberg, Fox Business, or whatever suits you. We all do this, because markets react to information. And we don't want to...
READ MORE
MEMBERS ONLY

The Market Just Pulled Back — Here’s Why

by Tom Bowley,
Chief Market Strategist, EarningsBeats.com
After weeks of relentless gains, the market finally pulled back—but Tom Bowley says it wasn’t random. He explains how options expiration, market maker positioning, and sentiment extremes helped trigger the reversal....
READ MORE
MEMBERS ONLY
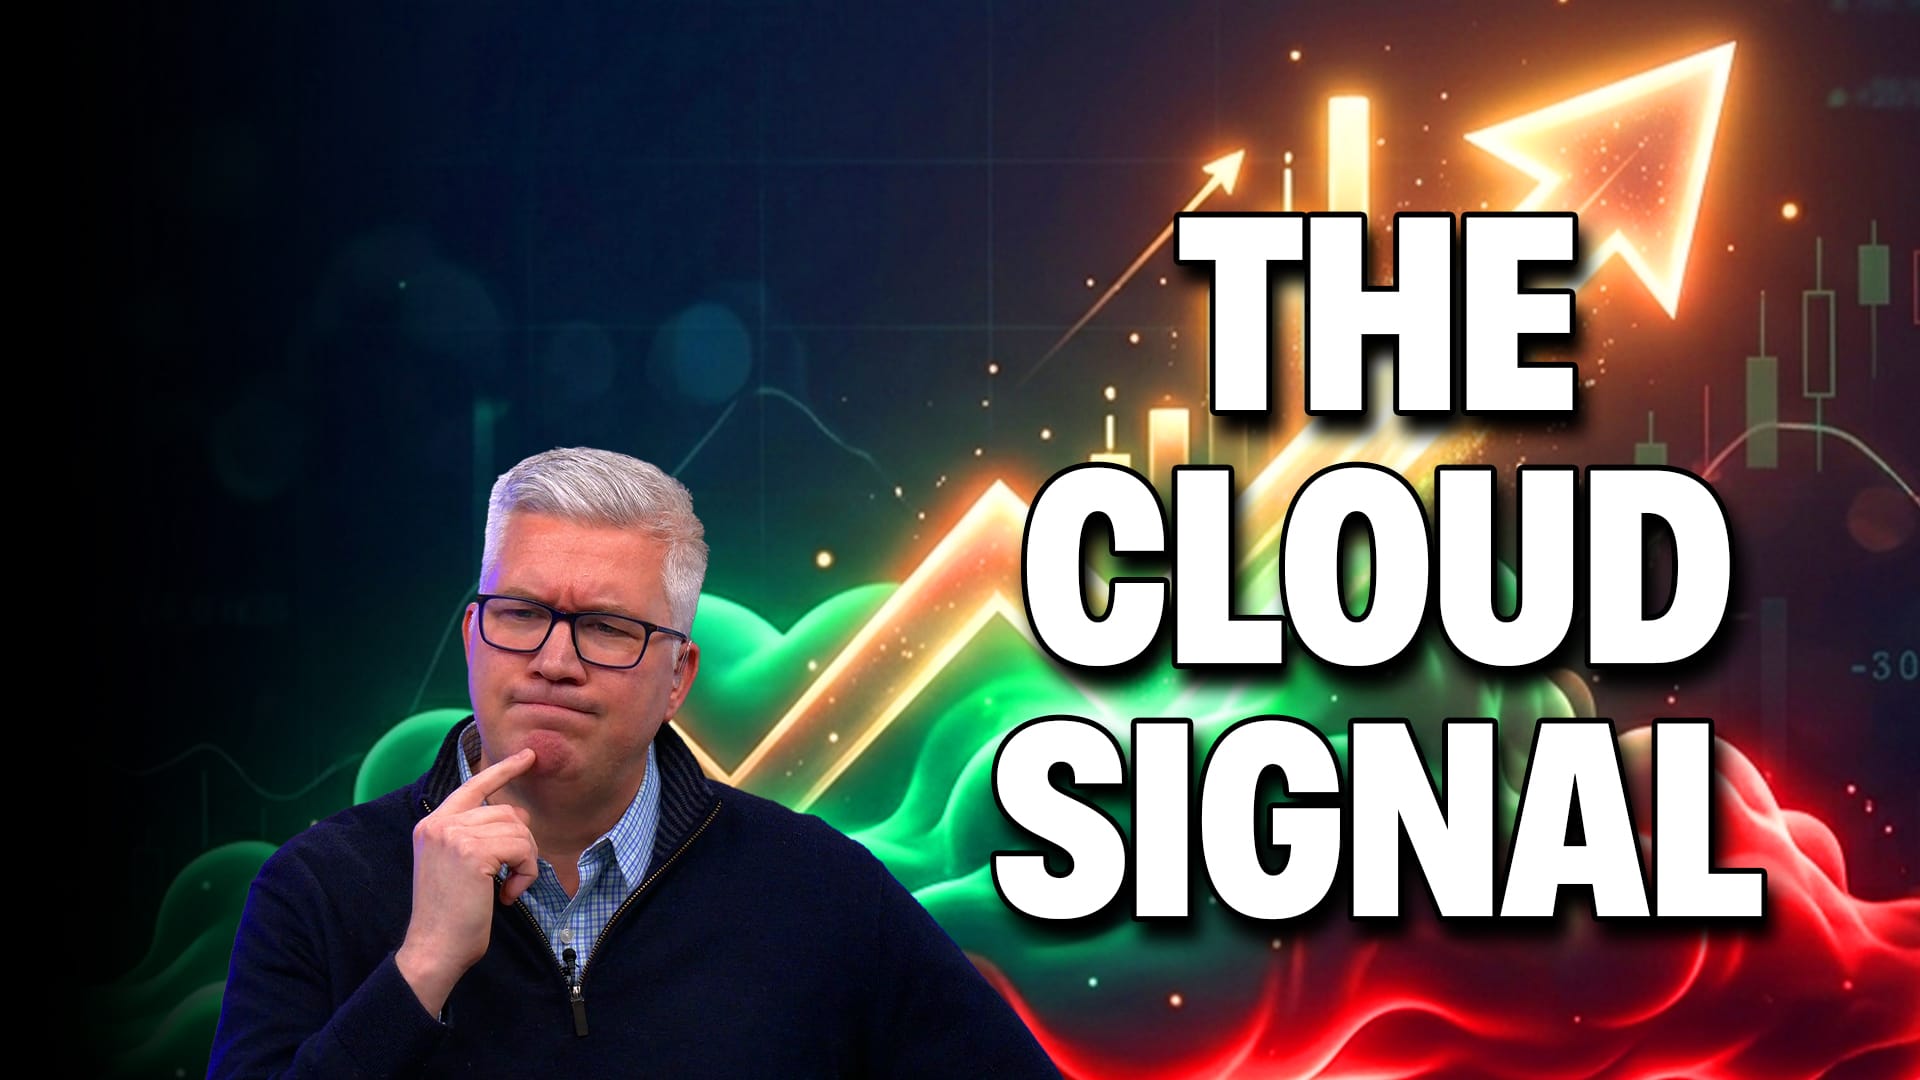
Ichimoku Cloud Charts Explained: Trend Signals Most Traders Miss
by David Keller,
President and Chief Strategist, Sierra Alpha Research
Dave Keller explains how Ichimoku Cloud charts help traders identify bullish and bearish trend shifts using real examples from Ford, CrowdStrike, and the S&P 500. Learn how the cloud can act as dynamic support and resistance during major market moves....
READ MORE
MEMBERS ONLY

Inflation Momentum Points to a New Up Leg in Yields

by Martin Pring,
President, Pring Research
Martin Pring analyzes bond yields against CPI and international bond yields, and supports the thesis that a secular bull market is underway in U.S. Treasury yields. ...
READ MORE
MEMBERS ONLY

The Healthcare Sector May Be Turning Bullish — Here's Why It Matters

by Mary Ellen McGonagle,
President, MEM Investment Research
Healthcare stocks are showing signs of strength as earnings improve, Medicare Advantage updates lift sentiment, and GLP-1 developments fuel growth in key industry names....
READ MORE
MEMBERS ONLY

Broadcom Breakout or Blowoff Top? Reading the Momentum Divergence
by David Keller,
President and Chief Strategist, Sierra Alpha Research
Broadcom has broken to new all-time highs, but weakening momentum may signal a potential blowoff top. Dave Keller, CMT, explains how bearish momentum divergences can foreshadow major reversals, and what price and RSI signals could confirm AVGO’s next move....
READ MORE
MEMBERS ONLY
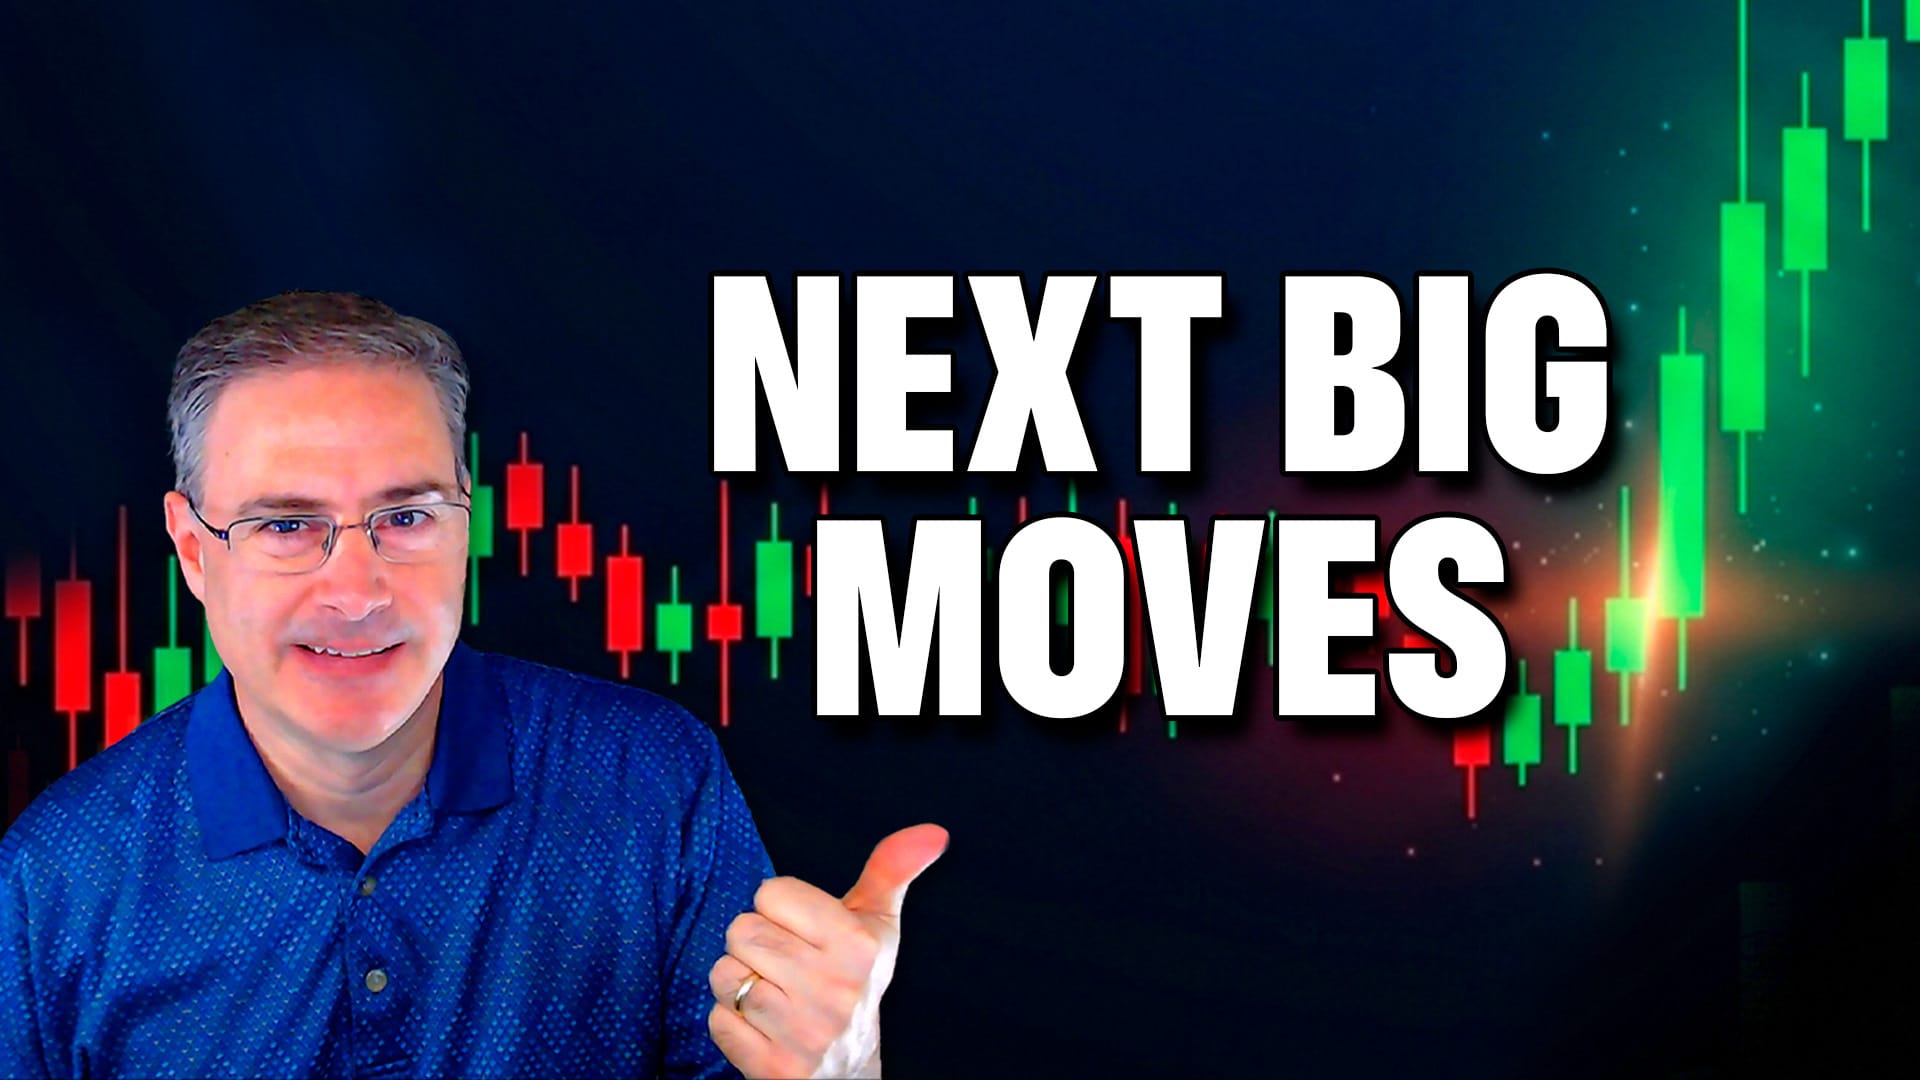
These Stocks May Be Ready for Their Next Big Move!

by Joe Rabil,
President, Rabil Stock Research
Big winning stocks often spend months building a base before momentum begins to accelerate. Joe Rabil highlights several stocks showing signs they may be preparing for a much bigger move....
READ MORE
MEMBERS ONLY

Retail Stocks Are Crashing Relative to the S&P 500. Here’s Why It Matters
Retail stocks are underperforming the S&P 500. Will this change when major retailers start reporting earnings next week? These charts will paint the full picture....
READ MORE
MEMBERS ONLY
Price Gap Analysis 101: Bullish vs. Bearish Gap Signals
by David Keller,
President and Chief Strategist, Sierra Alpha Research
Join David Keller as he explains how traders analyze price gaps....
READ MORE
MEMBERS ONLY

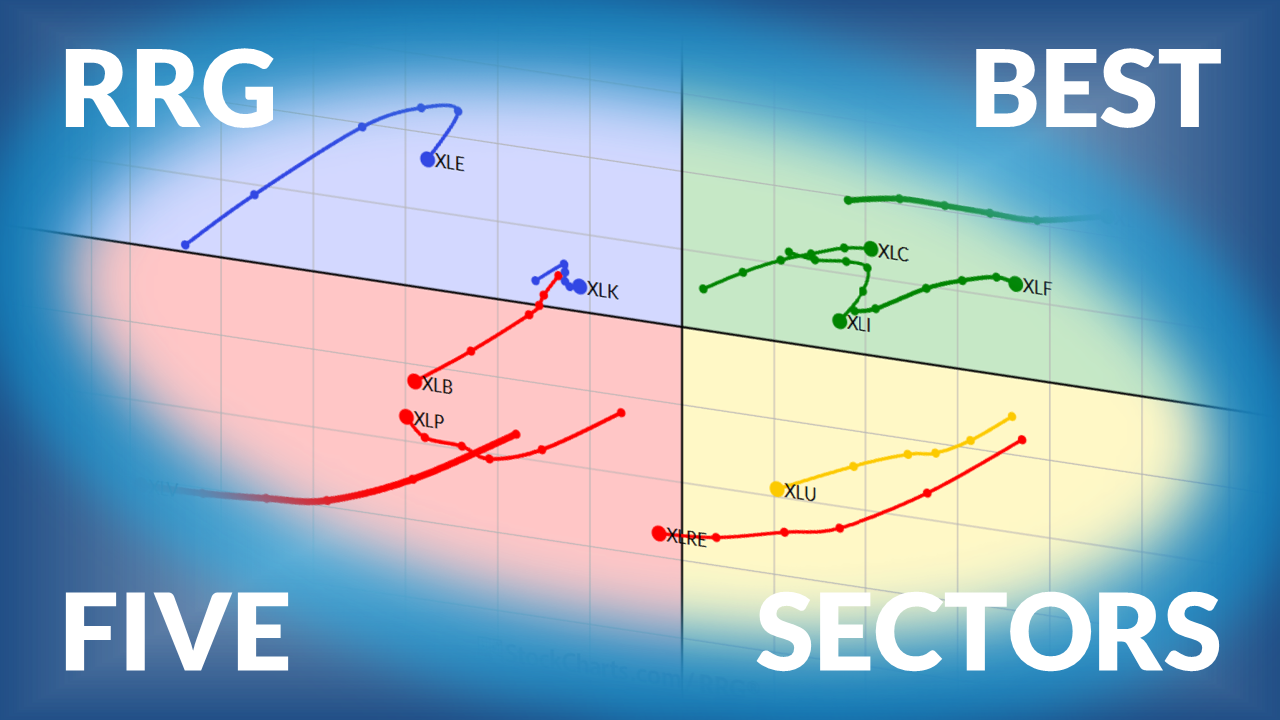
The Best Five Sectors This Week #65

by Julius de Kempenaer,
Senior Technical Analyst, StockCharts.com
Julius de Kempenaer, creator of Relative Rotation Graphs, presents his weekly update on sector rotation using RRGs....
READ MORE
MEMBERS ONLY
High-Low Line Turns, RSP Forms Bullish Pattern, Cybersecurity and Cloud ETFs Reverse
by Arthur Hill,
Chief Technical Strategist, TrendInvestorPro.com
Stocks continue to surge with SPY, QQQ, and the Technology sector leading the market higher. Arthur Hill analyzes new highs in the S&P 500, bullish continuation pattern in RSP, and reversals in cybersecurity and cloud ETFs....
READ MORE
MEMBERS ONLY
New Relative Strength in These Stocks!
by Joe Rabil,
President, Rabil Stock Research
Joe Rabil explains how to identify stocks showing new relative strength as they shift from weak to strong. He highlights key setups and reviews market conditions, including sentiment, volatility, and trend....
READ MORE
MEMBERS ONLY
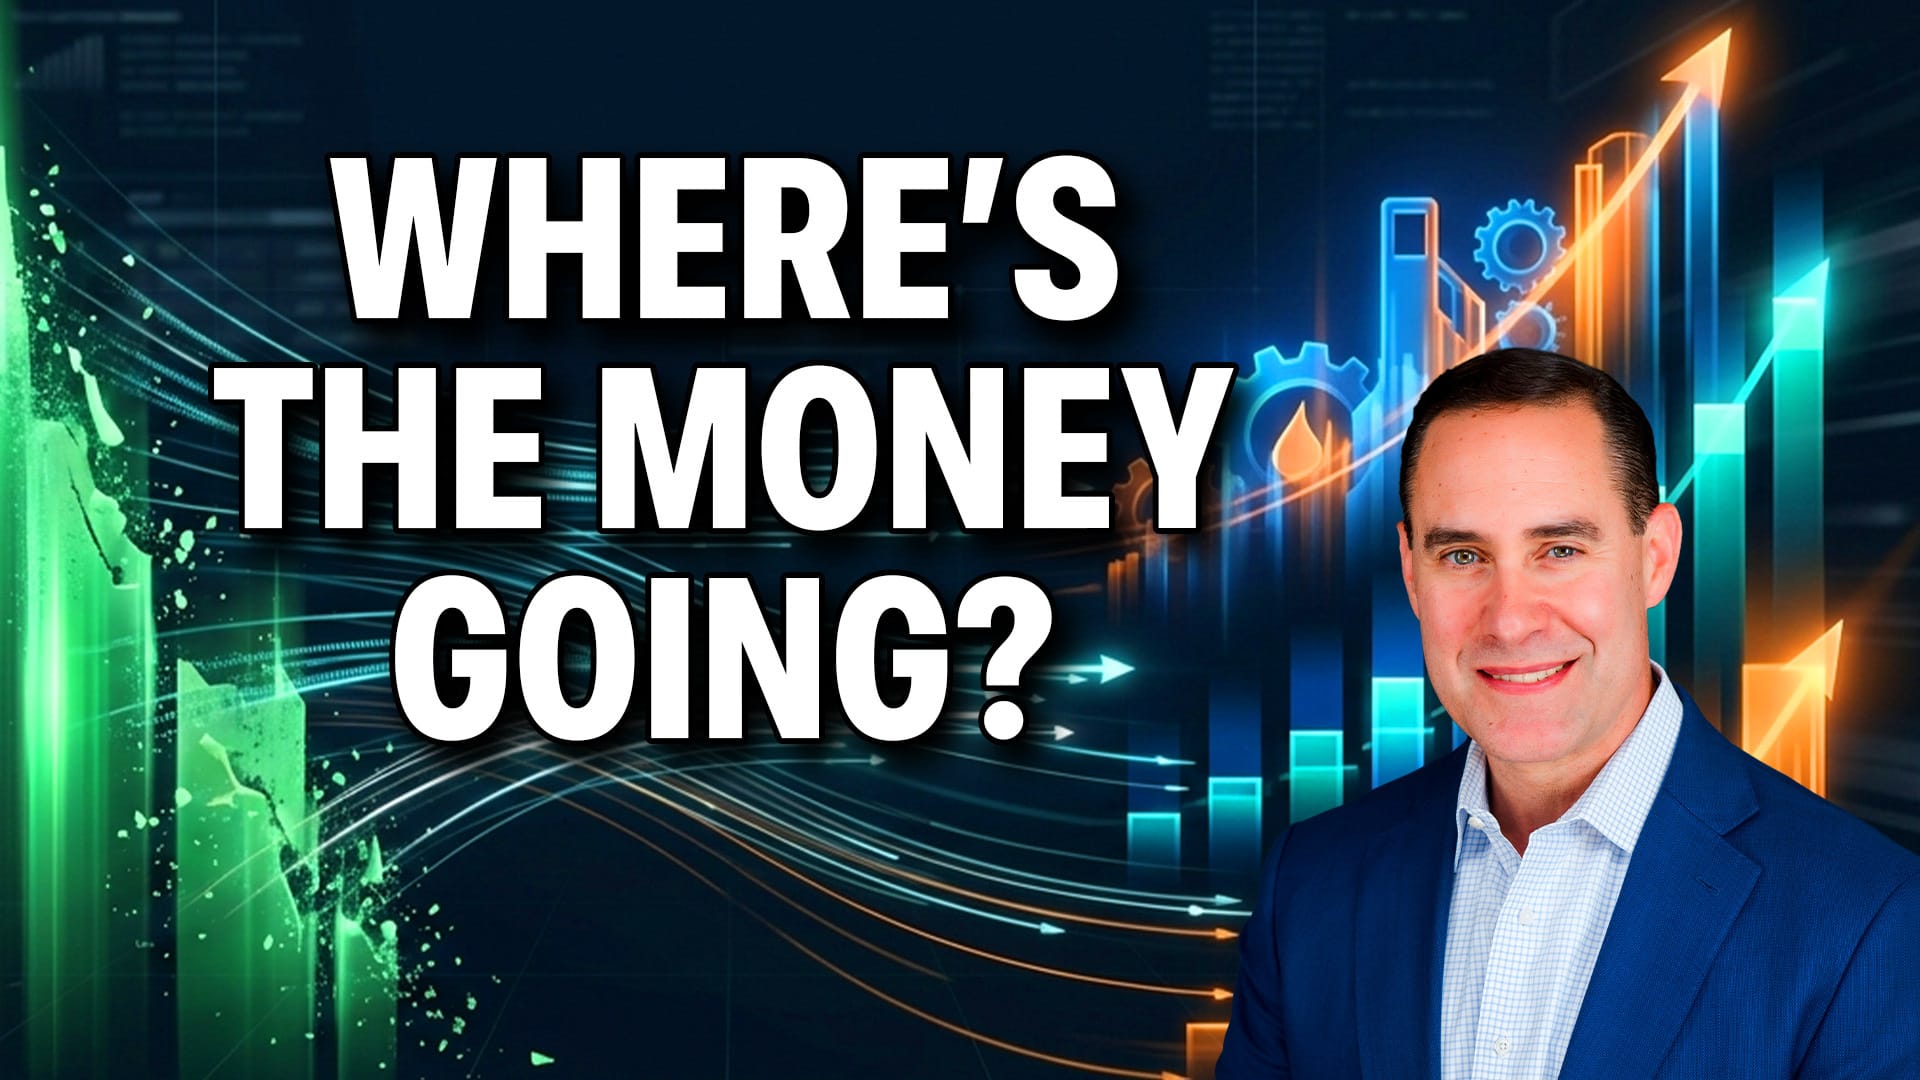
Market Rotation: Where’s the Money Moving Now?

by Frank Cappelleri,
Founder & President, CappThesis, LLC
Large-cap tech continues to drive the S&P 500 higher, but, beneath the surface, market leadership is narrowing. Frank Cappelleri breaks down where money may be rotating next and which sectors are starting to set up....
READ MORE
MEMBERS ONLY

The Next Leg Higher May Not Be in the U.S. Here’s Where to Look
European stocks are showing signs of improving technicals. A price gap, possible bull flag, rising 200-day moving average, and an RSI that's holding ground all point to potential bullish action....
READ MORE
MEMBERS ONLY

Top 10 Charts for May 2026 - New Highs and Strong Trends
by David Keller,
President and Chief Strategist, Sierra Alpha Research
Dave highlights 10 charts showing new highs and strong trends heading into May 2026, including leaders like CRWD, WDC, and JBL, along with early breakouts and sector strength to watch....
READ MORE
MEMBERS ONLY
Week Ahead: NIFTY Set for Positive Start, But These Levels Define a Broader Range
by Milan Vaishnav,
Founder and Technical Analyst, EquityResearch.asia and ChartWizard.ae
Milan Vaishnav examines the state of the Indian markets and what the next week holds, presenting his advice on how to approach the market and what the charts are saying....
READ MORE
MEMBERS ONLY
Earnings Are Driving This Market, Here’s Where to Look
by Mary Ellen McGonagle,
President, MEM Investment Research
Mary Ellen McGonagle illustrates how earnings are driving this market, where leadership is emerging, and what’s working right now....
READ MORE
MEMBERS ONLY

Gap Patterns in Focus: What GOOGL, AAPL, and the S&P 500 Are Telling Us
by David Keller,
President and Chief Strategist, Sierra Alpha Research
The S&P 500 and key stocks gapped to new highs, but follow-through will determine the trend. Dave Keller, CMT, explains “gap and run” versus “gap and fail” patterns, using recent moves in Oracle, Alphabet, and Apple to assess whether bullish momentum can continue....
READ MORE
MEMBERS ONLY

How to Use PPO for Trend and Aroon for Post-Correction Breakouts
by Arthur Hill,
Chief Technical Strategist, TrendInvestorPro.com
Arthur Hill presents a simple strategy for identifying long-term uptrends and short-term breakouts after corrections, using two important indicators....
READ MORE
MEMBERS ONLY
ADX and RSI Combo Show Next Buy for SPX
by Joe Rabil,
President, Rabil Stock Research
Joe Rabil explains how he measures the strength in SPX, digs into volatility, and examines some viewer-requested symbols....
READ MORE
MEMBERS ONLY

Corrections in Bull Markets; Tradable Pullbacks in Uptrends; Breakouts in XLI and XLB
by Arthur Hill,
Chief Technical Strategist, TrendInvestorPro.com
The stock market decline in March was a correction within a bull market. Arthur Hill highlights trend signals for sector ETFs and focuses on Industrials and Materials, two sectors that are set up for a bullish run. ...
READ MORE
MEMBERS ONLY

Earnings Season Chart Watch: Breakout, Breakdown, or Bounce?
by David Keller,
President and Chief Strategist, Sierra Alpha Research
With 20% of the S&P 500 reporting earnings this week, chart reactions may reveal more than headline results. Dave Keller, CMT reviews CSX, HCA, and RTX to show how breakouts, support tests, and breakdowns can signal changing expectations for future growth....
READ MORE
MEMBERS ONLY

Beyond the Headlines: Two Charts That Could Matter More than New Highs

by Jayanthi Gopalakrishnan,
Director of Site Content, StockCharts.com
The S&P 500 and Nasdaq hit new highs, but weakness in Dow Transports and Real Estate tells a more cautious story. See what the charts reveal about market strength. ...
READ MORE
MEMBERS ONLY

Bitcoin Awakens: A Powerful Crypto Setup Takes Shape as Risk-On Reigns
Bitcoin has posted a 30% return from its February 6, 2026 cycle low. Here are key price levels to watch as we head into a seasonally strong period for the cryptocurrency....
READ MORE
MEMBERS ONLY

Stocks Charge Higher: What to Watch After the V-Bottom
The S&P 500's 12.33% rise over 13 days is the best rally it has had since April 2020. Does the rally still have legs? Find out how price gaps, Fibonacci retracement levels, and earnings season could set up a potential near-term pause within the overall bullish trend....
READ MORE
MEMBERS ONLY

Week Ahead: Strong Start Likely; Need Sustained Close Above Key Levels For Rebound Extensions
by Milan Vaishnav,
Founder and Technical Analyst, EquityResearch.asia and ChartWizard.ae
The Nifty has rebounded from lower levels. Will it break above a key resistance level, or will it remain within a broad consolidation? Here's a deeper analysis of the Nifty 50 Index to help plan for the week ahead....
READ MORE
MEMBERS ONLY

SPX 7000: Evaluating the Past, Present, and Future
by David Keller,
President and Chief Strategist, Sierra Alpha Research
The S&P 500’s move above 7000 signals renewed strength after the March low. Dave Keller, CMT, highlights bullish trend model signals, key Fibonacci levels, and improving breadth data that could confirm whether this breakout can continue into Q2....
READ MORE
MEMBERS ONLY
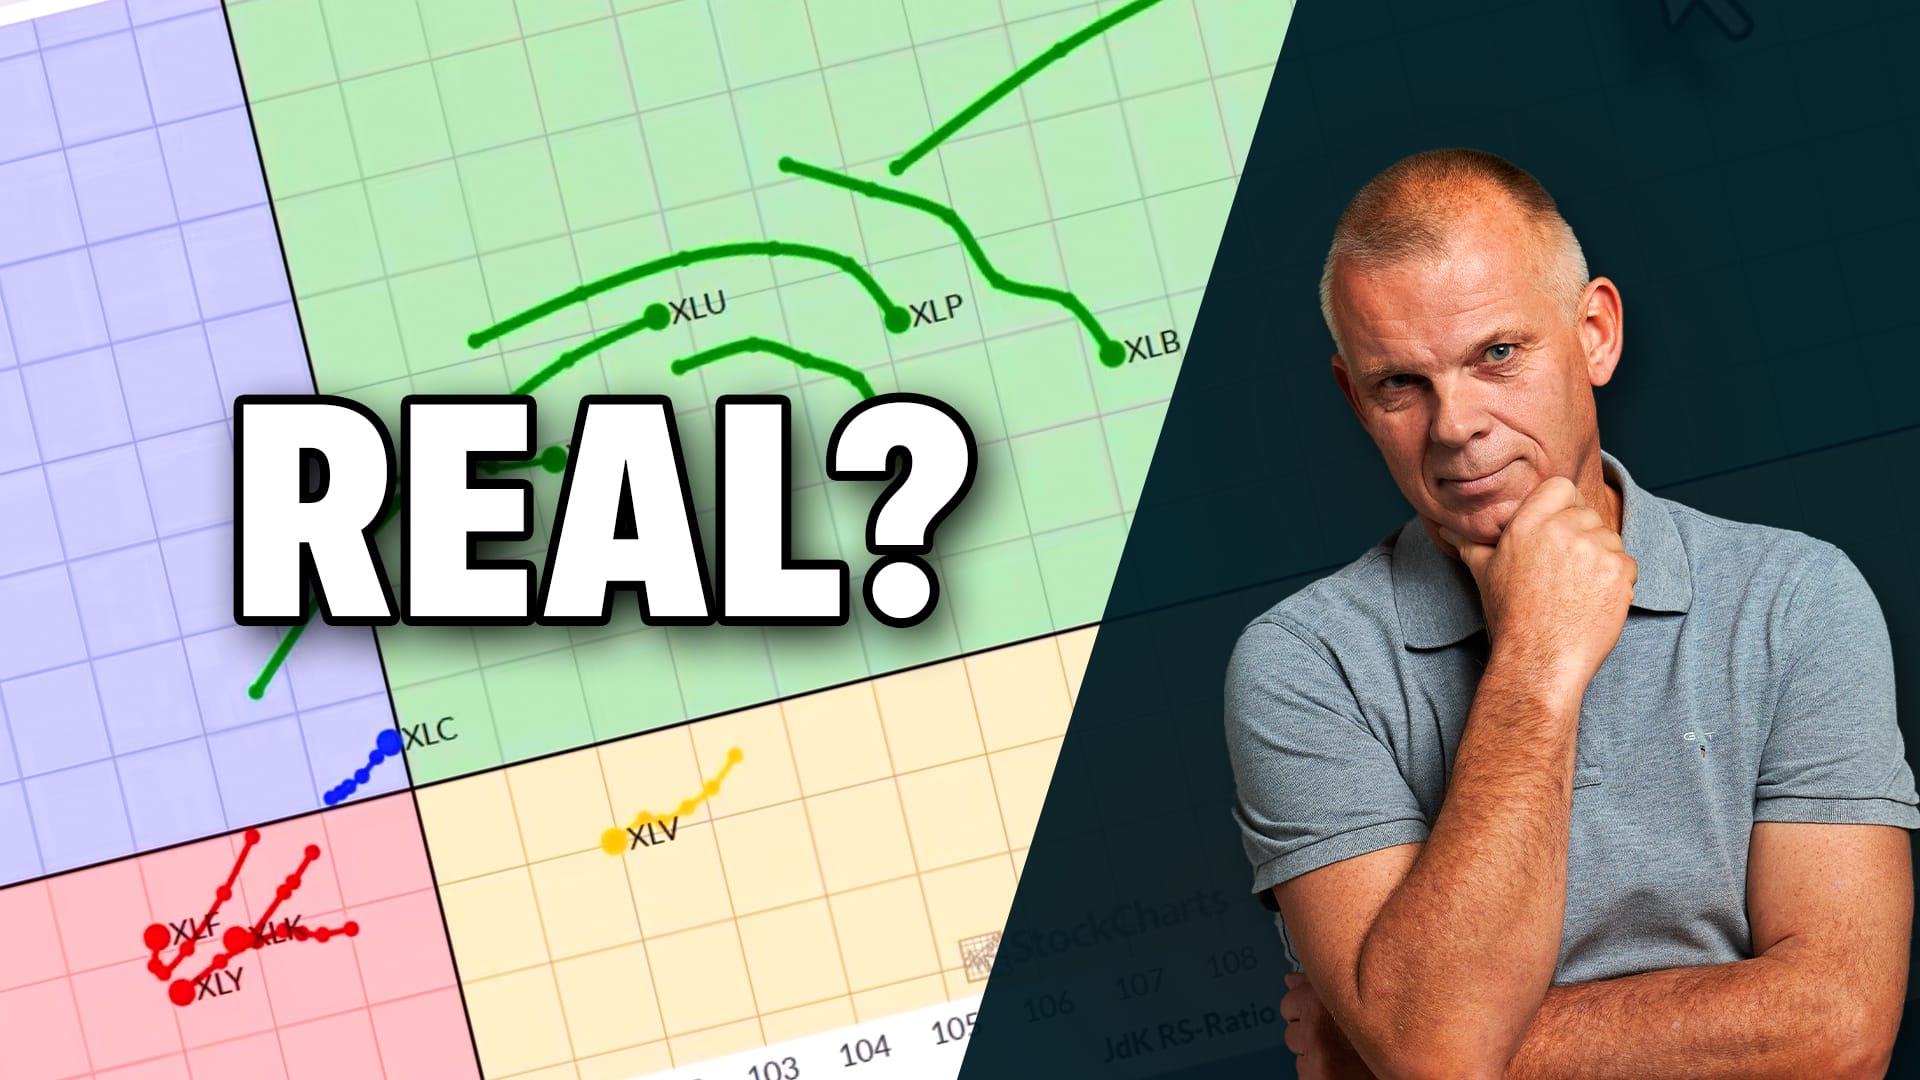
This Market Just Turned — Or Did It?
by Julius de Kempenaer,
Senior Technical Analyst, StockCharts.com
The market just made a strong move—but is it the start of a real trend or just a short-term shift? Julius de Kempenaer breaks down the latest RRG signals to reveal what’s going on beneath the surface....
READ MORE
MEMBERS ONLY

Breakouts Like These Can Lead To Exhilarating Gains
by Tom Bowley,
Chief Market Strategist, EarningsBeats.com
When the market has a quick and sharp turnaround to the upside, investors feel positive about their portfolio holdings. But what is their relative strength? Tom Bowley analyzes the relative strength of hotels, restaurants, and bars and two specific stocks....
READ MORE
MEMBERS ONLY

StockCharts Insider: ACP vs. SharpCharts—Why Using Both Beats Using One
by Karl Montevirgen,
The StockCharts Insider
Before We Dive In…
StockCharts has two main chart platforms, each powerful in their own right. But what does one do better than the other? What kind of trader or investor is either designed for? Which one better matches your needs?
Though both chart the same markets, comparing the two...
READ MORE
MEMBERS ONLY
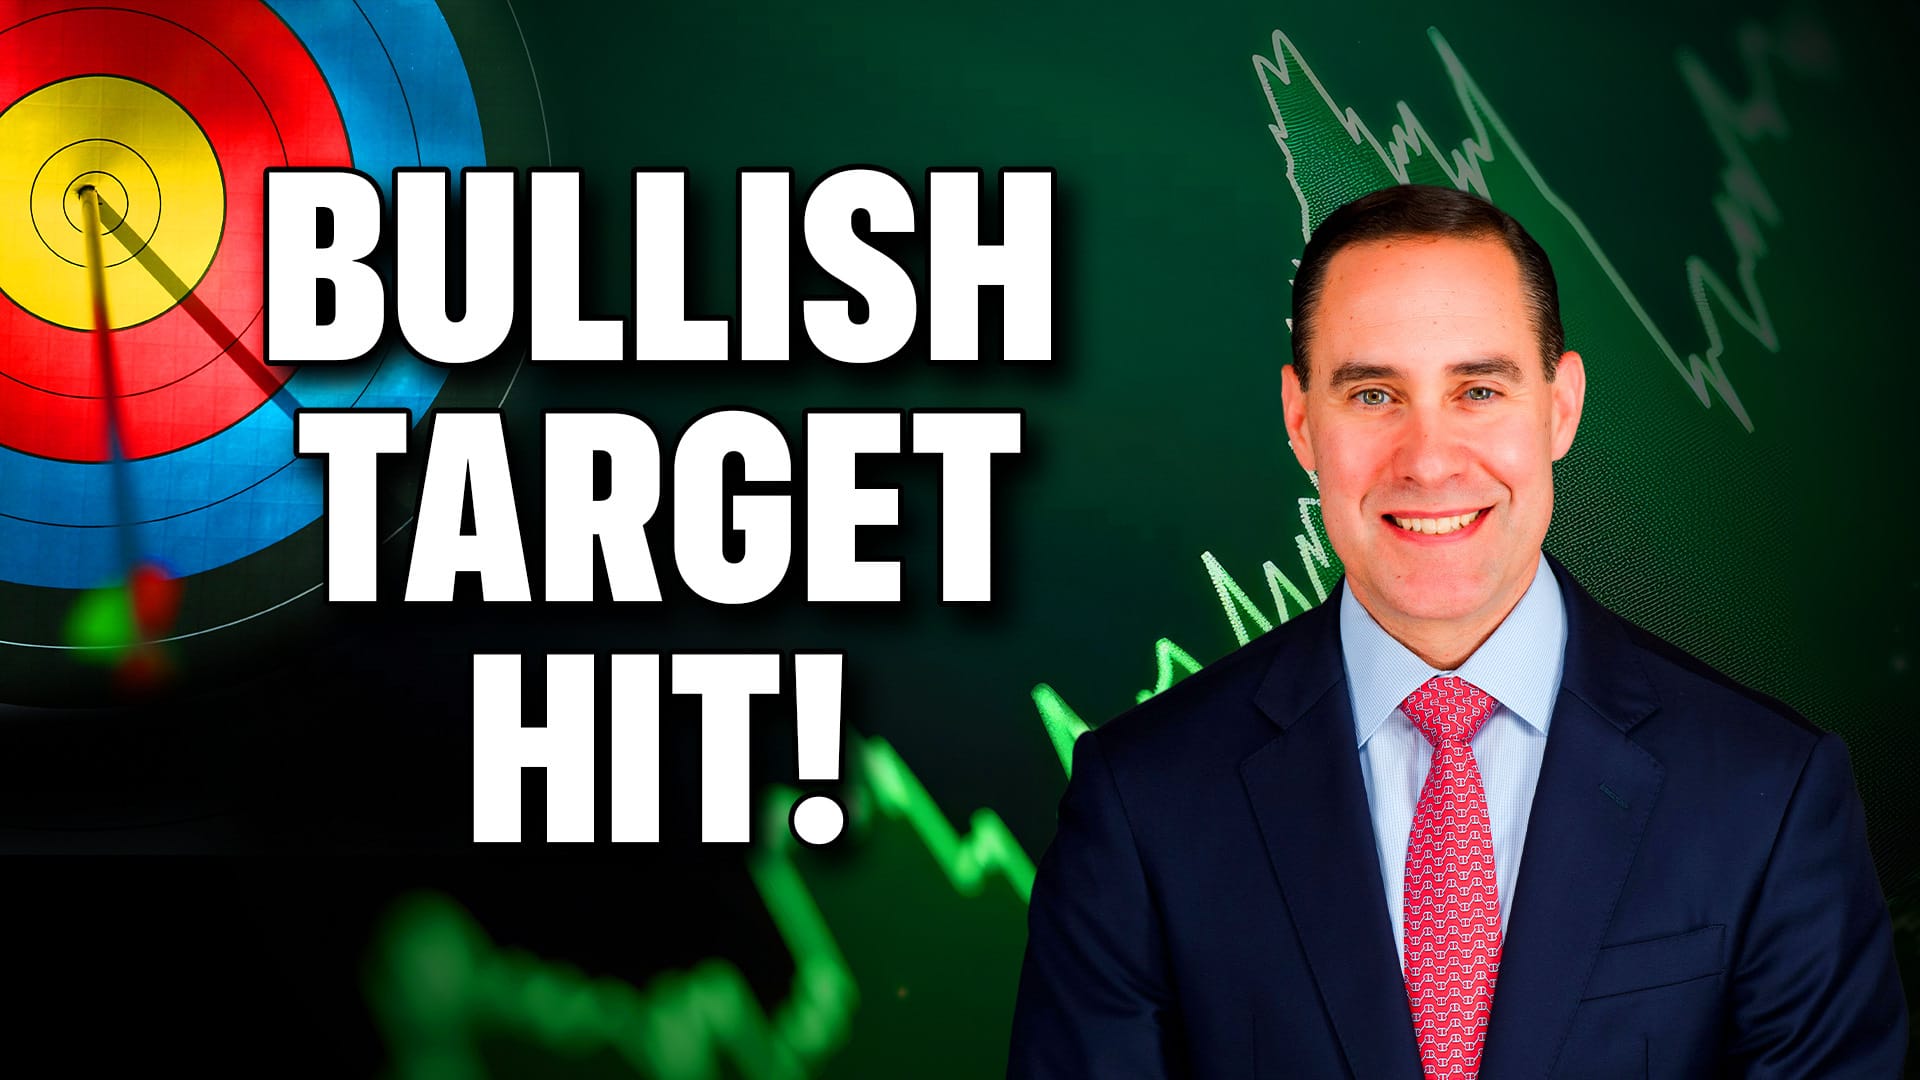
S&P 500 Just Hit Its First Bullish Target! What Comes Next?
by Frank Cappelleri,
Founder & President, CappThesis, LLC
The S&P 500 has reached its first bullish target of 2026 after a strong reversal. Frank Cappelleri of CappThesis breaks down what’s changed and what needs to happen next for the rally to continue....
READ MORE
MEMBERS ONLY
The Best Five Sectors This Week #61
by Julius de Kempenaer,
Senior Technical Analyst, StockCharts.com
Is now the time to take a more offensive approach? In this week's S&P 500 sector rotation update using RRG charts, Julius de Kempenaer shows that sector rankings still point to a defensive approach....
READ MORE
MEMBERS ONLY

Bullish Breakouts, Bearish Candles: What to Watch Next
by David Keller,
President and Chief Strategist, Sierra Alpha Research
Several stocks broke out this week, but bearish candle patterns suggest short-term exhaustion. Dave Keller, CMT, reviews VRSN, TGT, and TJX, showing how reversal signals- combined with overbought conditions- could lead to tactical pullbacks within broader uptrends....
READ MORE
MEMBERS ONLY

Stocks Are Climbing Again, But Are We in the Clear?
by Jayanthi Gopalakrishnan,
Director of Site Content, StockCharts.com
Stocks are rebounding as volatility eases, but oil prices and inflation remain key risks for investors to watch closely....
READ MORE
MEMBERS ONLY

Big Rally After Headlines — But What Happens Next?
by Tom Bowley,
Chief Market Strategist, EarningsBeats.com
A major headline-driven rally just pushed markets sharply higher—but can it last? Tom Bowley breaks down why this move may not be as strong as it looks and what could come next....
READ MORE