MEMBERS ONLY

Earnings Season Chart Watch: Breakout, Breakdown, or Bounce?

by David Keller,
President and Chief Strategist, Sierra Alpha Research
With 20% of the S&P 500 reporting earnings this week, chart reactions may reveal more than headline results. Dave Keller, CMT reviews CSX, HCA, and RTX to show how breakouts, support tests, and breakdowns can signal changing expectations for future growth....
READ MORE
MEMBERS ONLY

What the Nirvana Template Reveals About the Gulf ETFs

by Martin Pring,
President, Pring Research
Are U.S.-traded Gulf ETFs positioned to benefit from a potential cooling off in Middle East tensions? Martin Pring analyzes the charts of these ETFs and shares some surprising findings....
READ MORE
MEMBERS ONLY

Beyond the Headlines: Two Charts That Could Matter More than New Highs

by Jayanthi Gopalakrishnan,
Director of Site Content, StockCharts.com
The S&P 500 and Nasdaq hit new highs, but weakness in Dow Transports and Real Estate tells a more cautious story. See what the charts reveal about market strength. ...
READ MORE
MEMBERS ONLY

This Big Shift in Tech Stocks is Driving the Market

by Joe Rabil,
President, Rabil Stock Research
Joe Rabil breaks down the shift in tech stocks now driving the market. He highlights key names behind the move and reviews sector strength, sentiment, volatility, and where better opportunities may develop....
READ MORE
MEMBERS ONLY

Bitcoin Awakens: A Powerful Crypto Setup Takes Shape as Risk-On Reigns
Bitcoin has posted a 30% return from its February 6, 2026 cycle low. Here are key price levels to watch as we head into a seasonally strong period for the cryptocurrency....
READ MORE
MEMBERS ONLY
Can Earnings Keep the S&P 500 Above 7000? 5 Stocks to Watch
by David Keller,
President and Chief Strategist, Sierra Alpha Research
Dave Keller, CMT breaks down five key earnings stocks—TSLA, UNH, CSX, RTX, and HCA—and why this earnings season could decide if the S&P 500 holds above 7000. He highlights key support, resistance, and momentum signals to watch as results come in....
READ MORE
MEMBERS ONLY

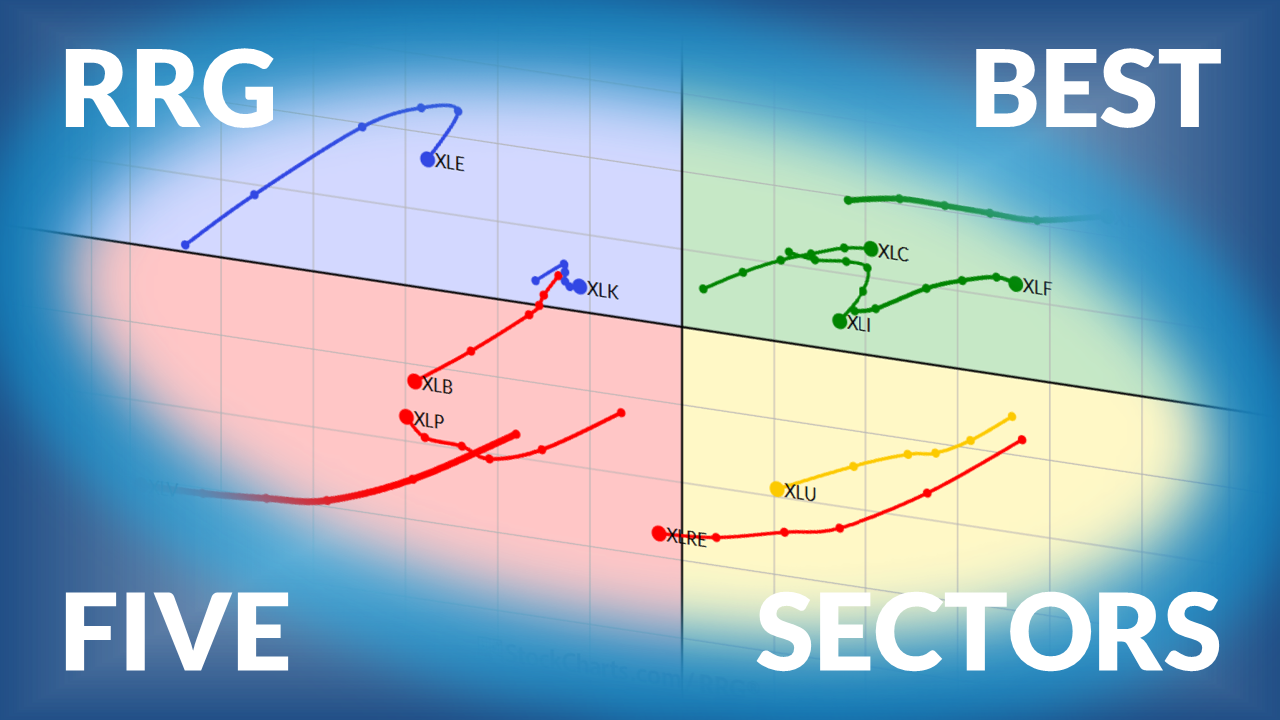
The Best Five Sectors This Week #62

by Julius de Kempenaer,
Senior Technical Analyst, StockCharts.com
Julius presents his weekly update on sector rotation for US stocks using Relative Rotation Graphs....
READ MORE
MEMBERS ONLY

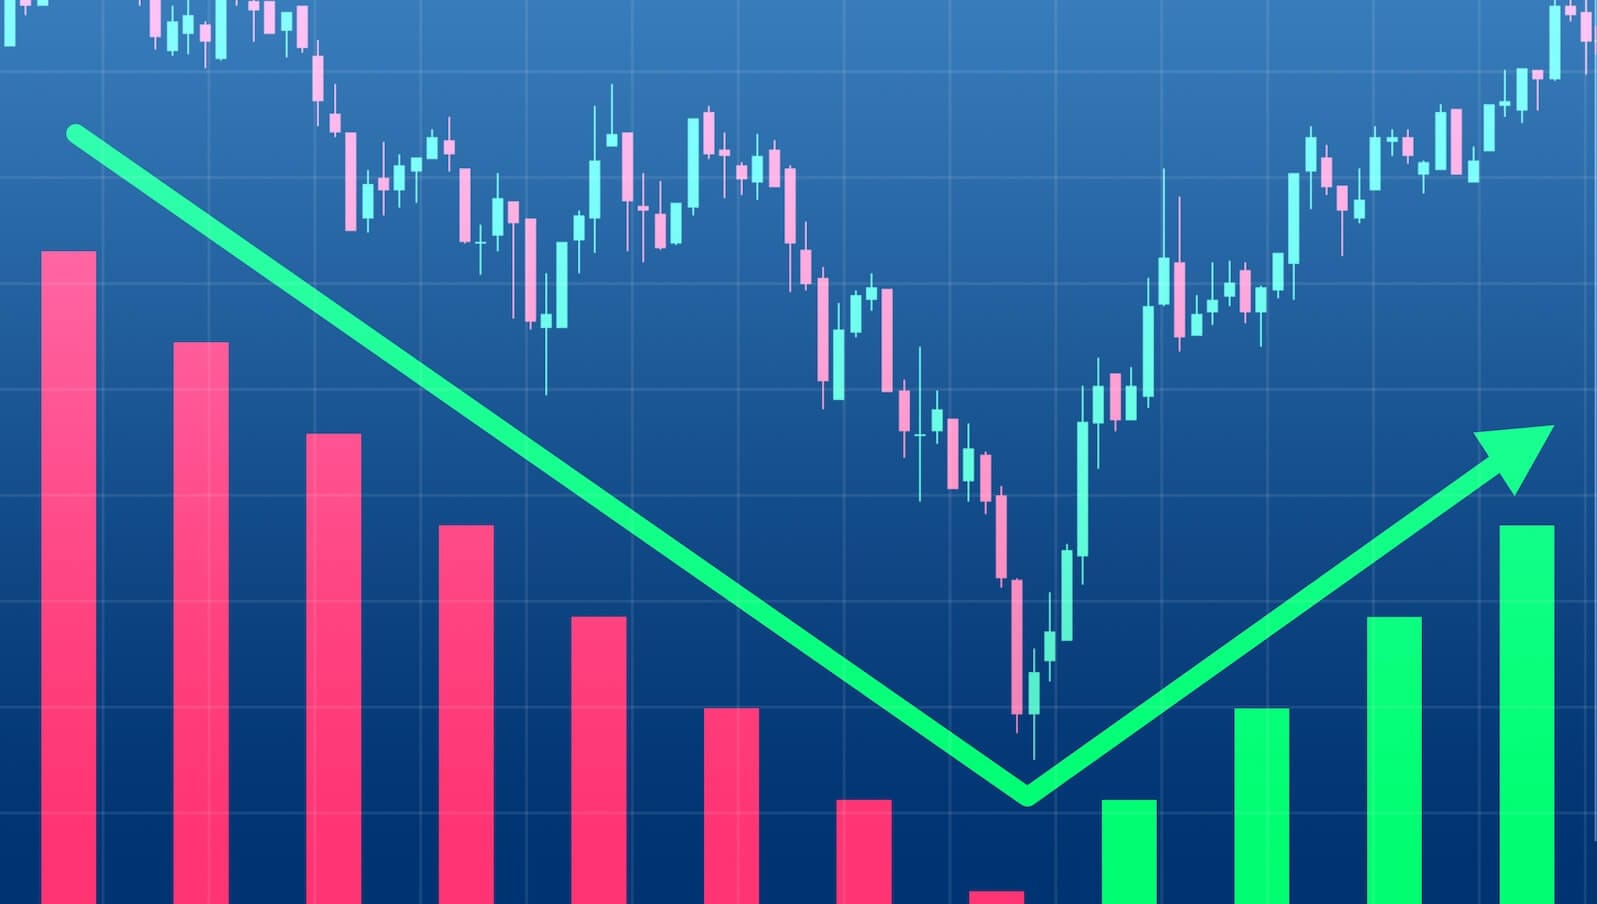
Stocks Charge Higher: What to Watch After the V-Bottom
The S&P 500's 12.33% rise over 13 days is the best rally it has had since April 2020. Does the rally still have legs? Find out how price gaps, Fibonacci retracement levels, and earnings season could set up a potential near-term pause within the overall bullish trend....
READ MORE
MEMBERS ONLY

Week Ahead: Strong Start Likely; Need Sustained Close Above Key Levels For Rebound Extensions

by Milan Vaishnav,
Founder and Technical Analyst, EquityResearch.asia and ChartWizard.ae
The Nifty has rebounded from lower levels. Will it break above a key resistance level, or will it remain within a broad consolidation? Here's a deeper analysis of the Nifty 50 Index to help plan for the week ahead....
READ MORE
MEMBERS ONLY

SPX 7000: Evaluating the Past, Present, and Future
by David Keller,
President and Chief Strategist, Sierra Alpha Research
The S&P 500’s move above 7000 signals renewed strength after the March low. Dave Keller, CMT, highlights bullish trend model signals, key Fibonacci levels, and improving breadth data that could confirm whether this breakout can continue into Q2....
READ MORE
MEMBERS ONLY

Oil is Dropping — Here’s Where the Smart Money is Moving Next

by Mary Ellen McGonagle,
President, MEM Investment Research
A drop in oil prices helps airline stocks and the travel & leisure space. Mary Ellen McGonagle looks at three stocks that are likely to benefit in this environment....
READ MORE
MEMBERS ONLY

Breakouts Like These Can Lead To Exhilarating Gains

by Tom Bowley,
Chief Market Strategist, EarningsBeats.com
When the market has a quick and sharp turnaround to the upside, investors feel positive about their portfolio holdings. But what is their relative strength? Tom Bowley analyzes the relative strength of hotels, restaurants, and bars and two specific stocks....
READ MORE
MEMBERS ONLY

SPY & QQQ Get Headlines, But Small- & Mid-Caps Lead + A Master ChartList Offer

by Arthur Hill,
Chief Technical Strategist, TrendInvestorPro.com
Small- and mid-cap stocks are trading near new highs. Arthur Hill compares the performance of major index ETFs and analyzes the iShares Russell 2000 ETF. ...
READ MORE
MEMBERS ONLY
The Market Hit New Highs — But This Is the Real Signal!
by Tom Bowley,
Chief Market Strategist, EarningsBeats.com
The market just hit new highs—but that’s not the real story. Tom Bowley of EarningsBeats explains why the shift back into growth stocks could be the signal that the bottom is in and what it means for the next move....
READ MORE
MEMBERS ONLY

Three Indicators to Watch In Case the Market Falters
by Martin Pring,
President, Pring Research
In this environment, will the stock market continue its bullish rally? Martin Pring looks at three indicators that can offer clues about whether the rally is sustainable....
READ MORE
MEMBERS ONLY

Stagflation Risk is Rising — How to Find Options Trades in a Volatile Market

by Tony Zhang,
Chief Strategist, OptionsPlay
OptionsPlay’s Tony Zhang explains how rising stagflation risk is driving market volatility and shares a structured approach to finding options trades in this environment. Learn how to identify opportunities and improve your trade selection....
READ MORE
MEMBERS ONLY
V-Bottom Strikes Again: Stocks Soar as Quality Lags
Technology, AI, and consumer discretionary stocks are driving the stock market higher. How much higher can the market go? These charts and tools can help you identify cracks in the market's foundation....
READ MORE
MEMBERS ONLY
The Best Five Sectors This Week #61
by Julius de Kempenaer,
Senior Technical Analyst, StockCharts.com
Is now the time to take a more offensive approach? In this week's S&P 500 sector rotation update using RRG charts, Julius de Kempenaer shows that sector rankings still point to a defensive approach....
READ MORE
MEMBERS ONLY
Can This Market Rally Actually Hold? 5 Charts to Watch
by David Keller,
President and Chief Strategist, Sierra Alpha Research
The market rally has been surprisingly strong—but can it hold? Dave Keller reviews five key charts to determine whether this move has staying power or is at risk of failing....
READ MORE
MEMBERS ONLY

Record Momentum: What MTUM’s Surge Says About Today’s Market
Momentum has been climbing steadily in the S&P 500 equity factor leaderboard. Here's how you can apply the technical signals in the iShares MSCI USA Momentum Factor ETF (MTUM) to navigate this asset group....
READ MORE
MEMBERS ONLY

Week Ahead: NIFTY Not Yet Out Of the Woods; Deal With Upticks In This Manner
by Milan Vaishnav,
Founder and Technical Analyst, EquityResearch.asia and ChartWizard.ae
The Nifty is trading below an important cluster of resistance levels. A break above this level would improve the technical structure, while a failure to hold above near-support levels would increase volatility. Milan Vaishnav analyzes what scenarios could play out next week....
READ MORE
MEMBERS ONLY

Why are Stocks Surging After the U.S.-Iran Ceasefire?
by Mary Ellen McGonagle,
President, MEM Investment Research
There's more that's driving the stock market higher besides the U.S.-Iran ceasefire. Mary Ellen McGonagle analyzes other factors that could be fueling the rally....
READ MORE
MEMBERS ONLY

The Market Just Confirmed a Turn; Is This the Start?
by Mary Ellen McGonagle,
President, MEM Investment Research
Follow along as Mary Ellen McGonagle breaks down a confirmed market turn and discusses where leadership is emerging. See what signals matter and what could come next....
READ MORE
MEMBERS ONLY

Stocks Are Climbing Again, But Are We in the Clear?
by Jayanthi Gopalakrishnan,
Director of Site Content, StockCharts.com
Stocks are rebounding as volatility eases, but oil prices and inflation remain key risks for investors to watch closely....
READ MORE
MEMBERS ONLY
These Stocks Are Close to Triggering New Buy Signals
by Joe Rabil,
President, Rabil Stock Research
Joe Rabil highlights stocks holding up through volatility and nearing new buy signals. He breaks down setups in semis, REITs, and materials, along with key indicators to watch as these patterns approach trigger points....
READ MORE
MEMBERS ONLY

U.S. Dollar: The 100–101 Zone Is the Pivot Between Bull and Bear
by Martin Pring,
President, Pring Research
After selling off sharply in 2025, the U.S. dollar has remained within a range. Martin Pring analyzes the price structure of the dollar using long- and short-term indicators. A lot depends on how the shorter-term indicators perform....
READ MORE
MEMBERS ONLY

The Best Five Sectors This Week #60
by Julius de Kempenaer,
Senior Technical Analyst, StockCharts.com
Julius de Kempenaer analyzes the weekly sector rotation in the U.S. stock market sectors using Relative Rotation Graphs. Here is this week's market update....
READ MORE
MEMBERS ONLY

StockCharts Insider: How to Use Retail Sentiment as a Risk Gauge

by Karl Montevirgen,
The StockCharts Insider
Before We Dive In…
In a previous article, we went over “smart money” positioning in the market. Now, let’s talk about your fellow retail investors. How are they feeling about the market, and what difference would it make if you were able to track their overall sentiment on a...
READ MORE
MEMBERS ONLY

Top 10 Charts to Watch: April 2026 Breakouts & Key Levels
by David Keller,
President and Chief Strategist, Sierra Alpha Research
Dave Keller breaks down the top 10 charts to watch for April 2026, focusing on breakout setups, key support tests, and emerging trends. These charts highlight what matters as the market navigates a potential counter-trend rally....
READ MORE
MEMBERS ONLY

Week Ahead: NIFTY May Not Stay Insulated from Global Tensions; Relative Outperformance Expected from Indian Equities
by Milan Vaishnav,
Founder and Technical Analyst, EquityResearch.asia and ChartWizard.ae
Though Indian equities are outperforming, the risk of an extended corrective phase looms. Milan Vaishnav analyzes what the next week has in store for the Indian stock market....
READ MORE
MEMBERS ONLY

A Proven Technique That’s Identified Every Market Bottom
by Mary Ellen McGonagle,
President, MEM Investment Research
Has the market bottomed? Mary Ellen McGonagle shares William O'Neil's insight on the "Follow-Through Day" concept, along with how it can help you resist the temptation to buy at the bottom....
READ MORE
MEMBERS ONLY
A Market Turn May Be Starting, What to Watch Now
by Mary Ellen McGonagle,
President, MEM Investment Research
Mary Ellen McGonagle breaks down a strong rally and what could signal a market turn ahead. See where strength is emerging and what to watch next....
READ MORE
MEMBERS ONLY

Is This Rally Real? What Needs to Improve for a Bullish Case
by David Keller,
President and Chief Strategist, Sierra Alpha Research
After a sharp countertrend rally, key signals remain mixed. Dave Keller, CMT, outlines three conditions for a bullish turn—rotation into offensive sectors, improving breadth, and breakouts in growth stocks—to determine if the S&P 500 can sustain a recovery in April....
READ MORE
MEMBERS ONLY

Zweig Breadth Thrust Sets Up; How to Identify a Stampede in Upside Participation
by Arthur Hill,
Chief Technical Strategist, TrendInvestorPro.com
Master the Zweig Breadth Thrust (ZBT) indicator with Arthur Hill. Learn the exact chart requirements for a valid signal and why the "breadth thrust" can be used to forecast powerful, long-term market rallies....
READ MORE
MEMBERS ONLY

A Key Signal That Suggests a Choppy Market Ahead
by Tom Bowley,
Chief Market Strategist, EarningsBeats.com
Extreme bullish or bearish sentiment is often an early sign of a stock market reversal. Tom Bowley shows you how to apply a sentiment indicator to identify potential reversals effectively....
READ MORE
MEMBERS ONLY
Stocks Keep Slipping — Here’s What’s Replacing Them
by Julius de Kempenaer,
Senior Technical Analyst, StockCharts.com
Stocks continue to weaken, but the real story is where money is rotating next. Follow along as Julius de Kempenaer breaks down the latest RRG signals to show what’s gaining strength—and why it matters now....
READ MORE
MEMBERS ONLY

A Significant Structural Change in the U.S. Stock Market May Be Underway
by Martin Pring,
President, Pring Research
Is the U.S. stock market going to make a secular turn? Martin Pring analyzes the relative performance of the NYSE relative to the S&P 500 and explains how it can indicate a potential shift in the market's structure....
READ MORE
MEMBERS ONLY
This Market Keeps Failing — Is Another Drop Coming?
by Tom Bowley,
Chief Market Strategist, EarningsBeats.com
Markets just failed again at a key level after the recent rebound, raising a bigger question about what’s ahead. Follow along as Tom Bowley explains why repeated resistance rejections could signal more downside....
READ MORE
MEMBERS ONLY

Below the 200-Day: What’s Next for the S&P 500?
by David Keller,
President and Chief Strategist, Sierra Alpha Research
The S&P 500 has broken below key support and its 200-day moving average, signaling a confirmed bearish phase. Dave Keller, CMT, outlines a downside target near 6200 and explains how short-term rallies could emerge before the broader downtrend continues....
READ MORE