MEMBERS ONLY
S&P 500 Breakdown: Next Downside Targets to Watch

by David Keller,
President and Chief Strategist, Sierra Alpha Research
The S&P 500 has broken key support, confirming a shift into a downtrend. Dave Keller outlines the next downside targets and the indicators to watch for a potential bounce or continued weakness....
READ MORE
MEMBERS ONLY

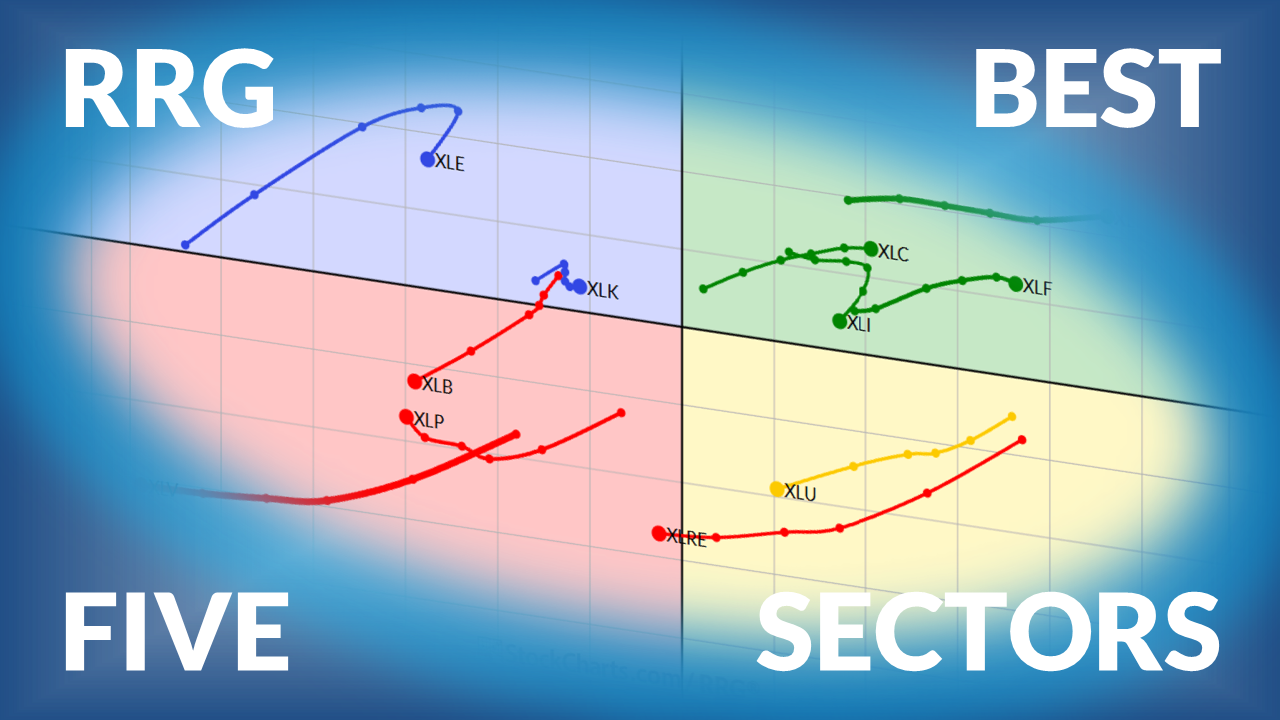
The Best Five Sectors This Week #59

by Julius de Kempenaer,
Senior Technical Analyst, StockCharts.com
Julius presents his weekly Sector Rotation Update for US sectors using Relative Rotation Graphs....
READ MORE
MEMBERS ONLY

Week Ahead: Short Trading Week May Keep Markets Anxious As They Stay Modestly Oversold

by Milan Vaishnav,
Founder and Technical Analyst, EquityResearch.asia and ChartWizard.ae
The Nifty has fallen below key short-term support levels. Milan Vaishnav analyzes the index via indicators such as RSI and MACD and suggests investors take a cautious and defensive approach. He also analyzes sector performance against the Nifty 500 Index....
READ MORE
MEMBERS ONLY

Market Leadership Is Changing, Here's Where to Look

by Mary Ellen McGonagle,
President, MEM Investment Research
Mary Ellen McGonagle analyzes shifting market leadership as defensive sectors gain strength and tech weakens. See where money is rotating and what to watch next....
READ MORE
MEMBERS ONLY
These Sectors Are Leading but the Market Is at a Turning Point

by Joe Rabil,
President, Rabil Stock Research
Joe Rabil highlights leading sectors and explains why oversold areas like tech and financials could see a bounce. He also reviews sentiment, volatility, and key support levels as the market approaches a potential turning point....
READ MORE
MEMBERS ONLY

Time for an Easter Rally?

by Martin Pring,
President, Pring Research
The recent stock market pullback may be hitting a floor. Discover which oversold indicators Martin Pring is monitoring for the next big trend reversal....
READ MORE
MEMBERS ONLY
S&P 500 Pullbacks Are Changing. What’s Different Now?

by Frank Cappelleri,
Founder & President, CappThesis, LLC
S&P 500 pullbacks are starting to behave differently following a confirmed breakdown and rising volatility. Frank Cappelleri explains what’s changed, what signals are weakening, and what needs to happen next....
READ MORE
MEMBERS ONLY

Loved to Unloved: Why the Financials Sector is the S&P 500 Bellwether Right Now
The Financials sector is lagging in 2026, but a trend reversal may be near. Analyze the key support levels and stock charts to watch before the start of the next earnings season....
READ MORE
MEMBERS ONLY

StockCharts Insider: Tracking Active Manager Positioning with the NAAIM Exposure Index

by Karl Montevirgen,
The StockCharts Insider
Before We Dive In…
What if you could see how active money managers are actually positioned—not what they’re saying, but what they’re actually doing with real capital? At times, there can be a big gap between the two. There is a way to track that positioning. It...
READ MORE
MEMBERS ONLY

How Long Can the Fed Hold Off Raising Rates?
by Martin Pring,
President, Pring Research
As interest rates around the world break to the upside, how long can the U.S. hold out against the trend?...
READ MORE
MEMBERS ONLY

Are Sentiment Indicators Bearish Enough to Be Bullish?
by David Keller,
President and Chief Strategist, Sierra Alpha Research
Sentiment has turned more bearish, but is it bearish enough to signal a market low? Join Dave Keller as he reviews the VIX, AAII survey, NAAIM exposure, and put/call ratios to show why conditions may not be extreme just yet....
READ MORE
MEMBERS ONLY

StockCharts Insider: Why Should I Trade This Stock and Not That One?
by Karl Montevirgen,
The StockCharts Insider
Before We Dive In…
You’re looking at two stocks. Both seem promising. Both are starting to move. But which one do you trade? Spend five minutes on social media forums and you’ll see this question pop up everywhere. Many traders choose based on the story, the brand, or...
READ MORE
MEMBERS ONLY

Week Ahead: NIFTY Stays On the Edge; This Zone Emerges As an Important Support Area
by Milan Vaishnav,
Founder and Technical Analyst, EquityResearch.asia and ChartWizard.ae
The Indian stock market declined this week, ending marginally in the red. Volatility remains elevated, suggesting nervousness among investors. Milan Vaishnav dissects the charts and suggests a defensive approach in the coming week....
READ MORE
MEMBERS ONLY

Why Oil Prices May Stay Elevated Into Mid-2026 and the Impact On the Stock Market
by Mary Ellen McGonagle,
President, MEM Investment Research
How long will oil prices stay elevated? Mary Ellen McGonagle analyzes the industry against the backdrop of the broader market....
READ MORE
MEMBERS ONLY

Cracks in Mega-Cap Leadership: What MSFT, AMZN, and TSLA Are Telling Us
by David Keller,
President and Chief Strategist, Sierra Alpha Research
Mega cap leaders are beginning to weaken beneath the surface of a rangebound market. Dave Keller, CMT, highlights bearish patterns in Microsoft, Amazon, and Tesla, raising concerns that deteriorating leadership could lead to further downside for the S&P 500 and Nasdaq....
READ MORE
MEMBERS ONLY

SPY Hits Key Moment as Bearish Breadth Signal Triggers; Yield Spreads Channel March 2025

by Arthur Hill,
Chief Technical Strategist, TrendInvestorPro.com
Breadth in the SPY, QQQ, and IWM are getting close to their 200-day moving averages. Arthur Hill looks beneath the surface and uncovers the price structure in the ETFs and analyzes the BBB spread....
READ MORE
MEMBERS ONLY

Fed Uncertainty Sparks Selloff — This Level Matters Now

by Tom Bowley,
Chief Market Strategist, EarningsBeats.com
Hot inflation data and Fed uncertainty triggered a sharp late-day selloff in stocks and bonds. Tom Bowley breaks down weakening breadth, rising volatility, and why the S&P 500’s key support level could determine what happens next....
READ MORE
MEMBERS ONLY

A Quiet Shift is Happening in This Market
by Julius de Kempenaer,
Senior Technical Analyst, StockCharts.com
A subtle but important shift is unfolding beneath the surface of the market. Follow along as Julius de Kempenaer breaks down where leadership is quietly emerging and where weakness still hasn’t resolved....
READ MORE
MEMBERS ONLY
This Pullback May Be Setting Up the Next Move Higher
by Joe Rabil,
President, Rabil Stock Research
A market pullback with improving sentiment may be setting up the next move higher. Follow along as Joe Rabil highlights key signals and stocks showing constructive setups....
READ MORE
MEMBERS ONLY

Are Investors Too Bearish? What Sentiment Signals Say About Stocks Now
Investor pessimism is spiking. Discover what the critical sentiment signals say now and bookmark these charts to catch the moment the market reverses toward optimism....
READ MORE
MEMBERS ONLY

StockCharts Insider: Market Breadth 101 — What Index Price Doesn’t Tell You
by Karl Montevirgen,
The StockCharts Insider
Before We Dive In…
When the S&P 500 makes a 1% move up, it feels like the market is exhibiting strength. But is it? Sometimes an index will rise because a handful of mega-caps are doing the heavy lifting. What you don’t see are the other...
READ MORE
MEMBERS ONLY
These Charts Could Decide the Next Market Move
by David Keller,
President and Chief Strategist, Sierra Alpha Research
Why hasn’t the market broken down, even amid weakening breadth? Dave Keller shows how a small group of mega-cap stocks may be holding the indexes together, and the key levels that could decide the next market move....
READ MORE
MEMBERS ONLY
The Best Five Sectors This Week #57
by Julius de Kempenaer,
Senior Technical Analyst, StockCharts.com
Julius de Kempenaer presents his weekly stock market update on sector rotation using Relative Rotation Graphs....
READ MORE
MEMBERS ONLY

Utilities, Staples, and Health Care: Are Defensive Sectors Signaling Market Trouble?
Defensive sectors such as Utilities, Staples, and Health Care are strengthening. Here's how you can monitor sector strength and position your portfolio appropriately....
READ MORE
MEMBERS ONLY
Oil Prices Triggering a Market Domino Effect
by Mary Ellen McGonagle,
President, MEM Investment Research
Oil volatility is creating a chain reaction across markets as rising prices, fuel inflation fears, and push interest rates higher. Follow along as Mary Ellen McGonagle highlights the sectors weakening, the areas holding up, and the key levels investors should be watching....
READ MORE
MEMBERS ONLY

Large-Caps Hold Up Better Than Smalls; Trend Signals for SPY; A Bullish Setup in Based Metals
by Arthur Hill,
Chief Technical Strategist, TrendInvestorPro.com
Despite geopolitical tensions, the S&P 500 has held up well and is relatively close to its recent highs. When does the pullback turn into a long-term downtrend? Arthur Hill analyzes the market environment and highlights what investors should monitor....
READ MORE
MEMBERS ONLY

Market Breadth Breakdown: Why the Market Has “Bad Breadth” in March 2026
by David Keller,
President and Chief Strategist, Sierra Alpha Research
The S&P 500 may look stable, but market breadth is quietly deteriorating. Dave Keller breaks down key breadth indicators and explains why weakening participation could signal trouble ahead....
READ MORE
MEMBERS ONLY

Beyond the Hormuz Headlines: Oil’s Bullish Foundations Run Deeper Than You Think
by Martin Pring,
President, Pring Research
Before the Iran conflict, the energy market had reached a point in the cycle where a major uptrend was overdue. Martin Pring does a deep dive into the technical backdrop of crude oil and shares his analysis....
READ MORE
MEMBERS ONLY

Not Even Rising Fear Can Crack This Market
by Tom Bowley,
Chief Market Strategist, EarningsBeats.com
Fear is rising across markets as volatility spikes and headlines pile up. In this video, Tom Bowley explains why key accumulation signals and improving growth leadership suggest buyers are still supporting this market....
READ MORE
MEMBERS ONLY

Stock Market Is Sending Mixed Signals; Here’s What to Watch

by Jayanthi Gopalakrishnan,
Director of Site Content, StockCharts.com
The stock market is sending mixed signals. See what the charts reveal about current trends and why semiconductors may lead the next move....
READ MORE
MEMBERS ONLY

These Tech Stocks Are Close to Triggering Upside Breakouts
by Joe Rabil,
President, Rabil Stock Research
Joe Rabil highlights several tech stocks forming constructive pullbacks that could soon trigger upside breakouts. He also reviews S&P 500 market conditions, key support levels, and how relative strength helps confirm emerging setups....
READ MORE
MEMBERS ONLY
S&P 500 Pullbacks Keep Getting Bought. Why?
by Frank Cappelleri,
Founder & President, CappThesis, LLC
S&P 500 pullbacks keep attracting buyers, even as momentum signals weaken. Join Frank Cappelleri as he explains why dip-buying continues to support the market in spite of rising volatility and mixed technical signals....
READ MORE
MEMBERS ONLY

Tech May Be About to Regain Part of Its Old Leadership Role
by Martin Pring,
President, Pring Research
Though Technology has been among the weakest performers of late, recent action in XLK suggests that the sector has the potential to reclaim a leadership role....
READ MORE
MEMBERS ONLY

Week Ahead: NIFTY Rests At Crucial Support; Any Close Below This Level May Invite Incremental Weakness
by Milan Vaishnav,
Founder and Technical Analyst, EquityResearch.asia and ChartWizard.ae
Nifty has slipped back and closed exactly at its 100-week moving average, which has historically been a support level. Is it at risk for more downside?...
READ MORE
MEMBERS ONLY

Market Breadth Breaks Down, but These Stocks Still Look Strong
by David Keller,
President and Chief Strategist, Sierra Alpha Research
Even as market breadth deteriorates and the S&P 500 slips below key support, strong setups still exist. Dave Keller, CMT, highlights Marathon Petroleum, Target, and Palantir — three charts showing breakouts, trend strength, and improving momentum into March....
READ MORE
MEMBERS ONLY

Trend Signals in Agriculture ETF; Wheat and Soybeans Turn Up; A Tribute to John Murphy
by Arthur Hill,
Chief Technical Strategist, TrendInvestorPro.com
Money has moved into agricultural commodities, which offer true diversification in a portfolio. Arthur Hills analyzes the chart of DBA and zeroes in in soybeans, wheat, and livestock....
READ MORE
MEMBERS ONLY

Stocks Wobble as Oil Spikes: What the Charts Are Telling Investors
by Jayanthi Gopalakrishnan,
Director of Site Content, StockCharts.com
The stock market turned volatile as oil prices surged. Here's what the charts are telling investors about the market's next move....
READ MORE
MEMBERS ONLY
Headlines Hit the Market But Buyers Keep Stepping In
by Tom Bowley,
Chief Market Strategist, EarningsBeats.com
The stock market has been rattled by geopolitical headlines, which have driven up crude oil prices. In this video, Tom Bowley shares his observations on what's happening beneath the surface....
READ MORE